 Defense
Vulnerability Management, Assessments and Vulnerability scanning is sometimes treated a with distain in the Offensive security community, I personally don’t understand that. Vulnerability management is key to inputting into security strategy, architecture, and operations. It’s coupled heavily to many other processes such as:
- Asset Management
- Risk Management
- Patch Management
- Change & Release Management
- Security Testing
- Security Monitoring
Before we start deploying let’s think about some areas for consideration when performing vulnerability scans:
- Scope
- Asset/Hosts
- IP Ranges
- Hostnames
- Connectivity
- VPNs
- LAN/WAN
- Device Types and Configuration
- Domain
- Workgroup
- Appliance
- ICS
- Printers
- Network Equipment
- Unauthenticated View
- Authenticated View
- Auth Types
- Protocols
- Scheduling
- Authority to execute
- Asset/Hosts
- Impact
- Performance
- Availability
- Confidentiality
- Objectives and Outcomes
- Reporting
- Information Flow
- Report Storage and Confidentiality
I’m not going to go into detail on all these areas, hopefully it’s obvious but if not shout at me online and I’ll write more about this part. Just please, please don’t think “it’s just a scan”, this isn’t like you click one button and the job is done. Outside of scanning isn’t that simple to start with, you also need to realise vulnerability identification is just one part of vulnerability management. Once you have the outputs they need to be understood, contextualised and they need to feed into risk management, vulnerability management, patch management etc. Treating this as “just a scan” is a sure-fire way to not enable business value from these activities. Now we’ve got that part over, I want to dive into the configuring of scans and looking at the outputs! (The fun stuff!). First off let’s get an appliance deployed.
OVA Deployment
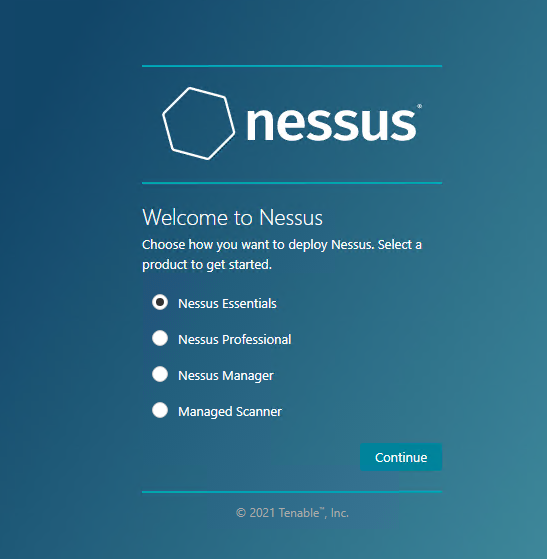
Ok so we can deploy Nessus on Linux, OSX and Windows. We can install on top of an OS or use appliances from Tenable. For this blog I’m doing to deploy using the appliance for simplicity.
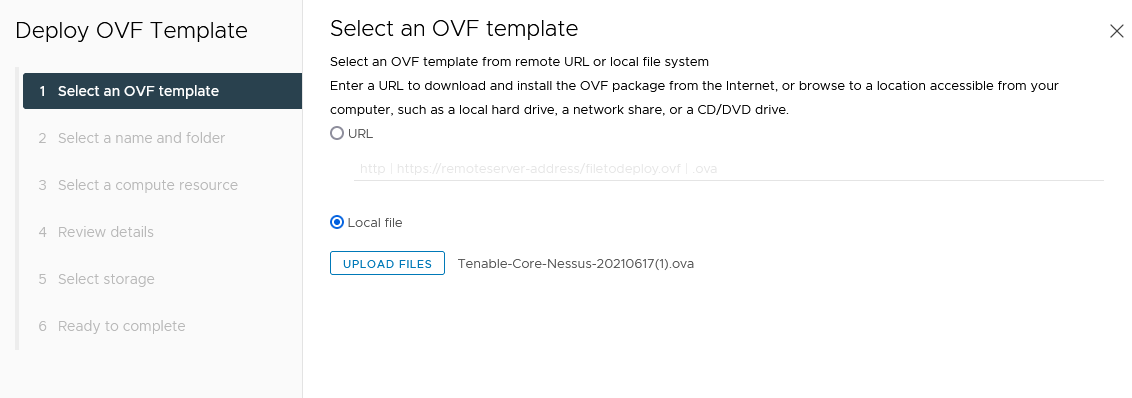
Once the OVA has been deployed you need to power on the VM.
In this example the appliance is on a segment with DHCP.
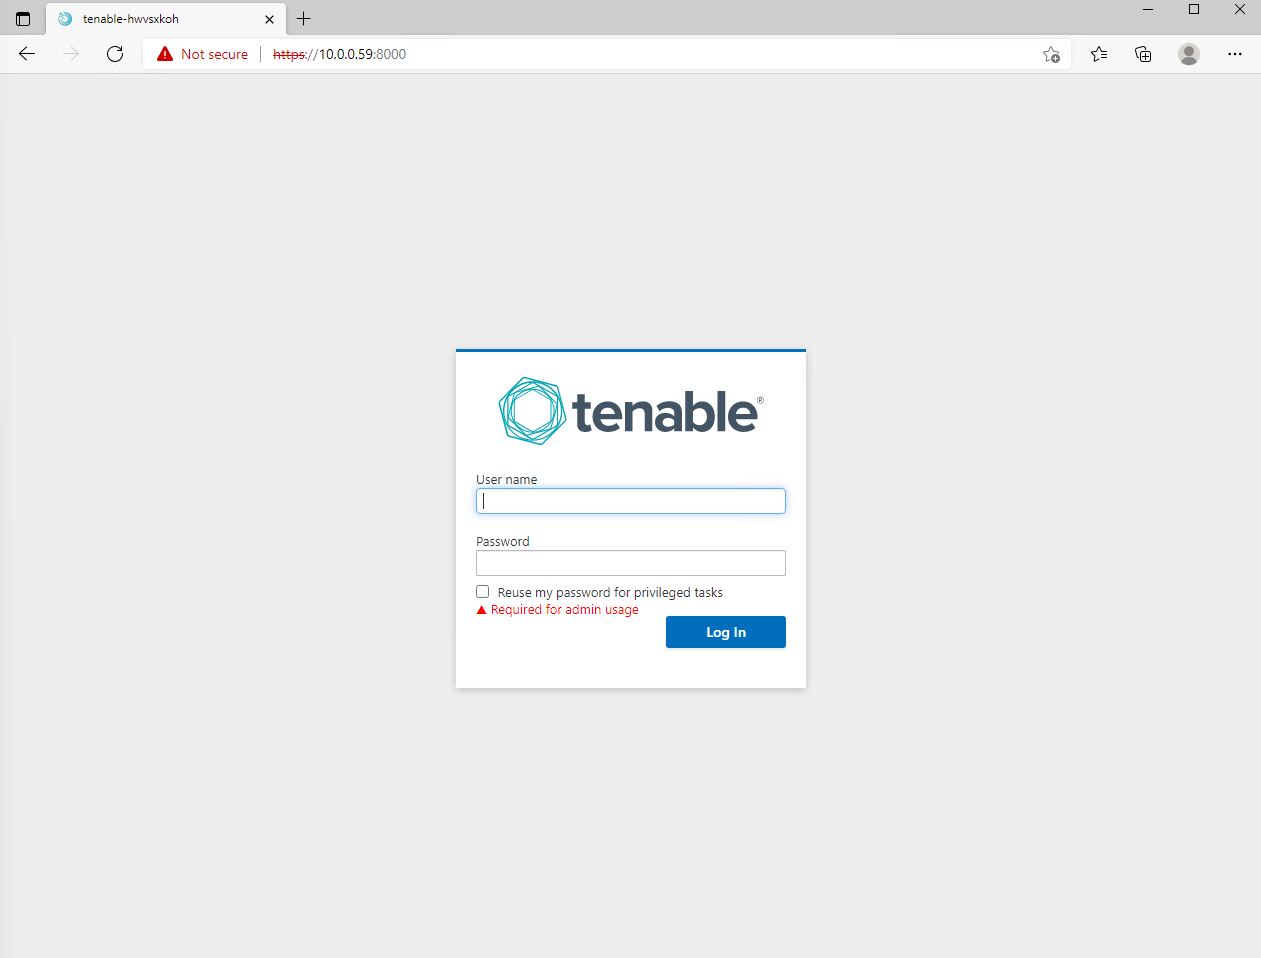
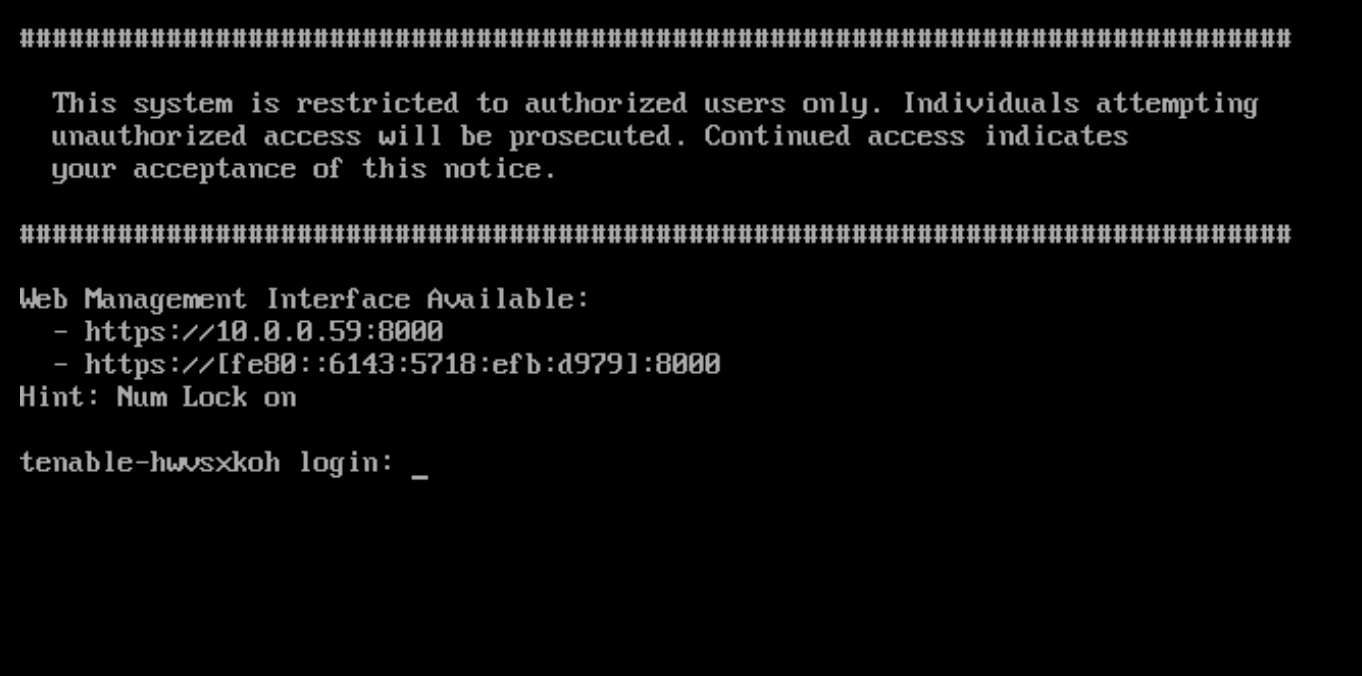
We now use a web client to browse to the appliance:
The default credentials are:
wizard:admin
(Red Team/Penetration testers take note of this as if you find an appliance and someone hasn’t configured this default creds could give you root access).
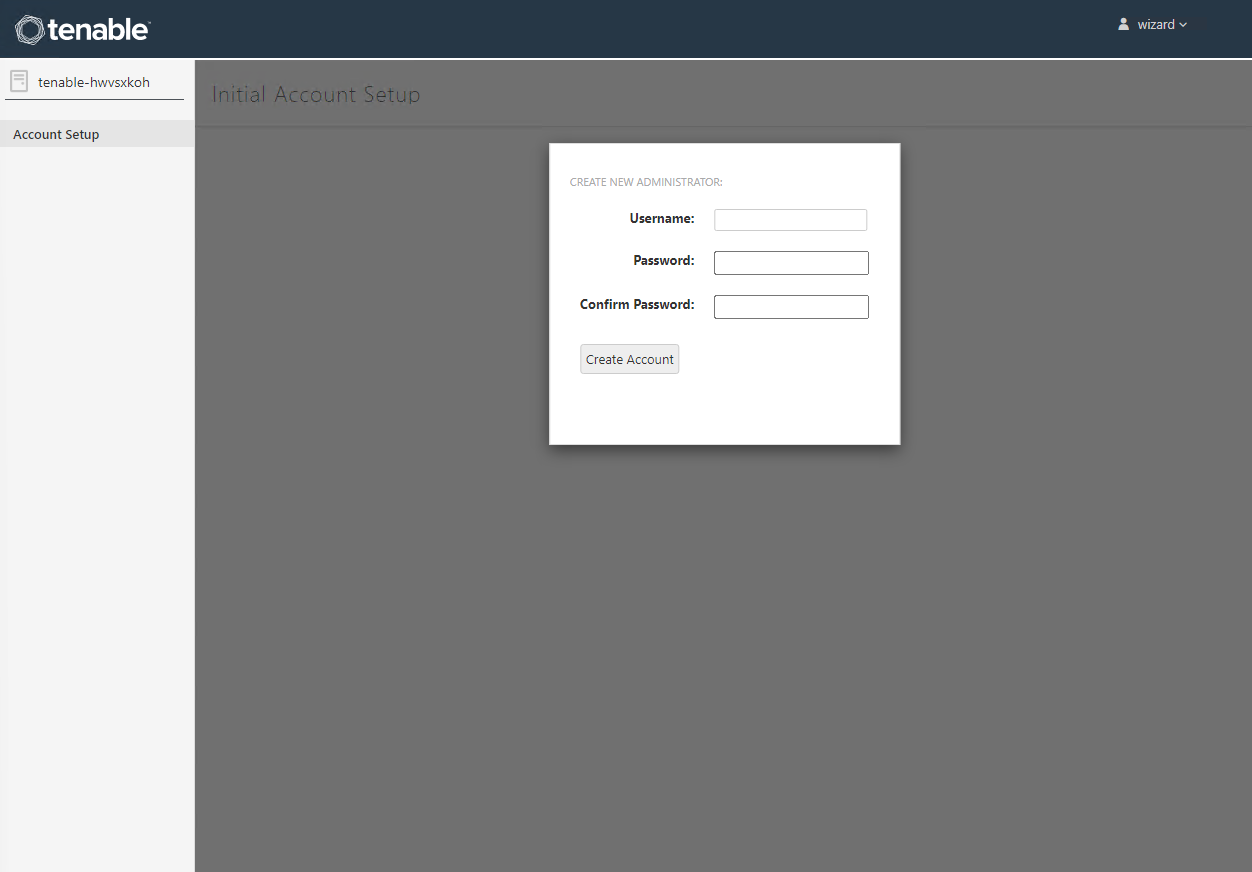
Now create a new username and password (must be 14 characters and complex)
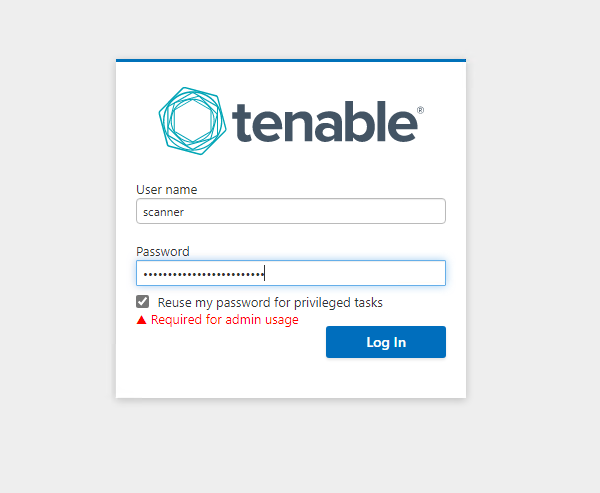
Now we log in:
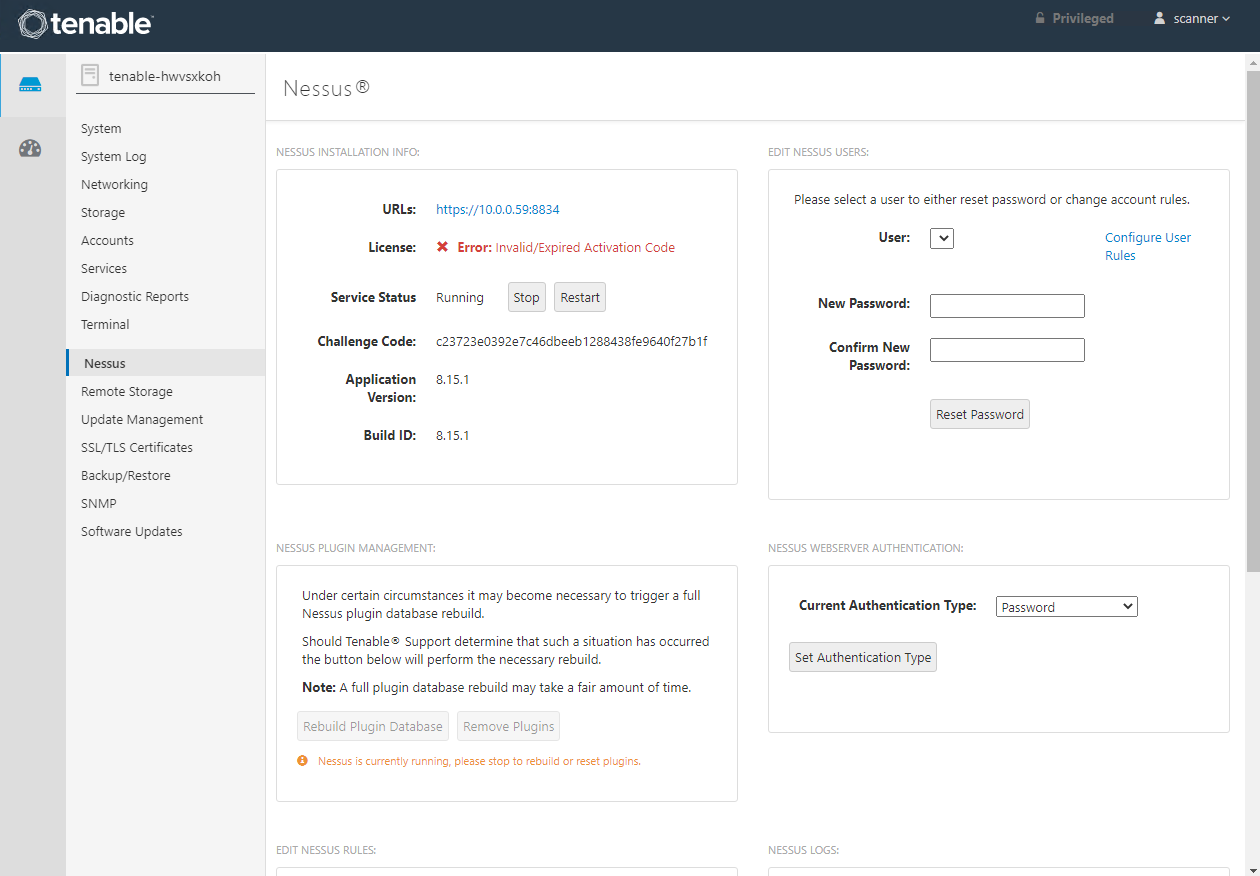
We can configure our appliance management system here. This is essentially a cockpit for the appliance a bit like this: https://cockpit-project.org/
The application services are running on a web service on TCP 8834
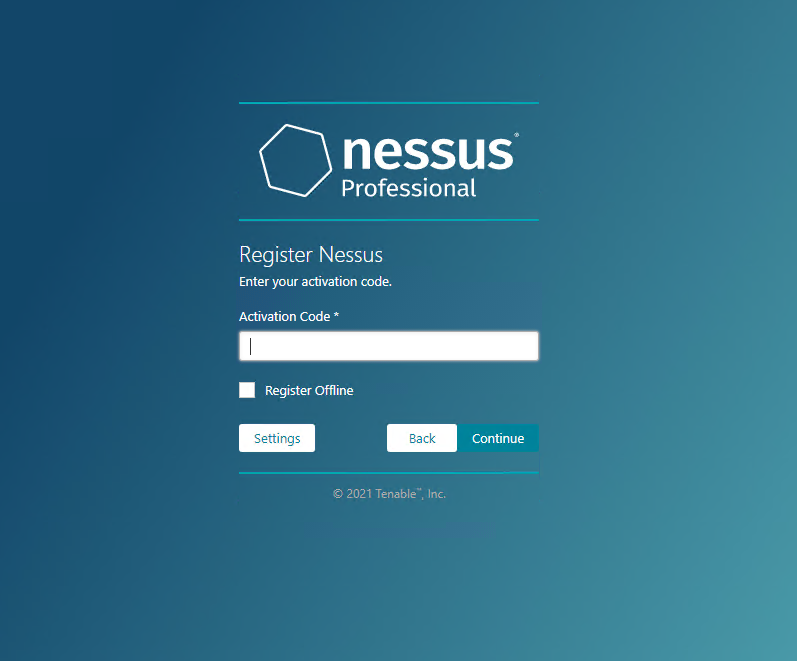
Click CONTINUE then enter your activation code:
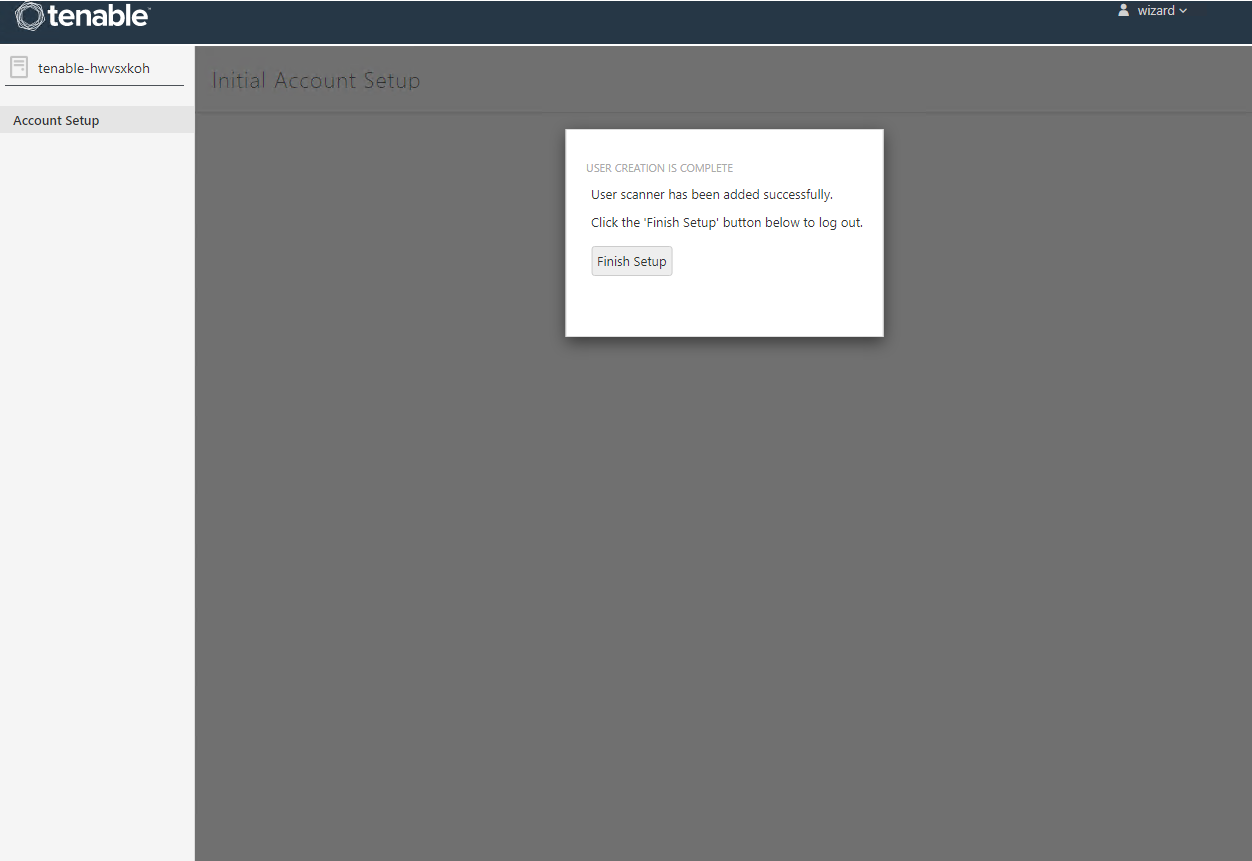
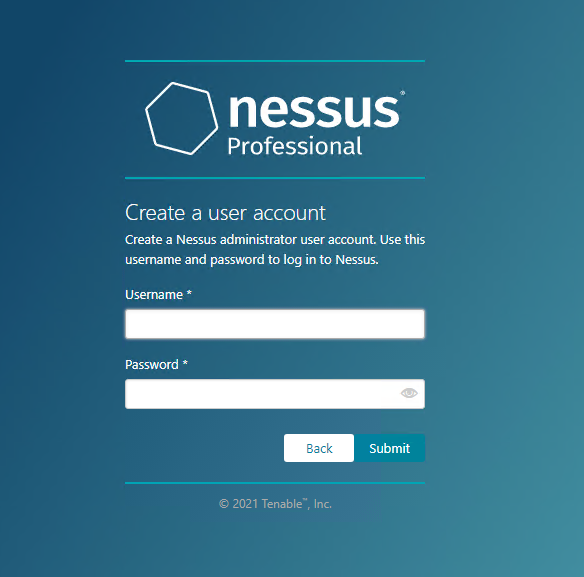
Click CONTINUE then create a user account:
Now go and make a tea/coffee.
Ok cool, now we’ve had 2 cups of tea we are ready to get configuring!
Now we should consider the purpose of this scanner, for here we are going to emulate this being used on a short-term vulnerability assessment or penetration test, so I’m not going to configure SMTP integration (I can check back when scans are complete etc).
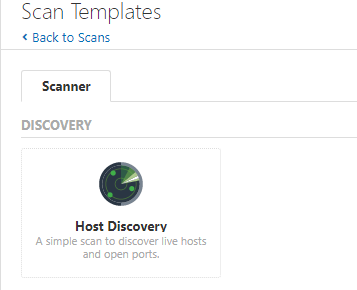
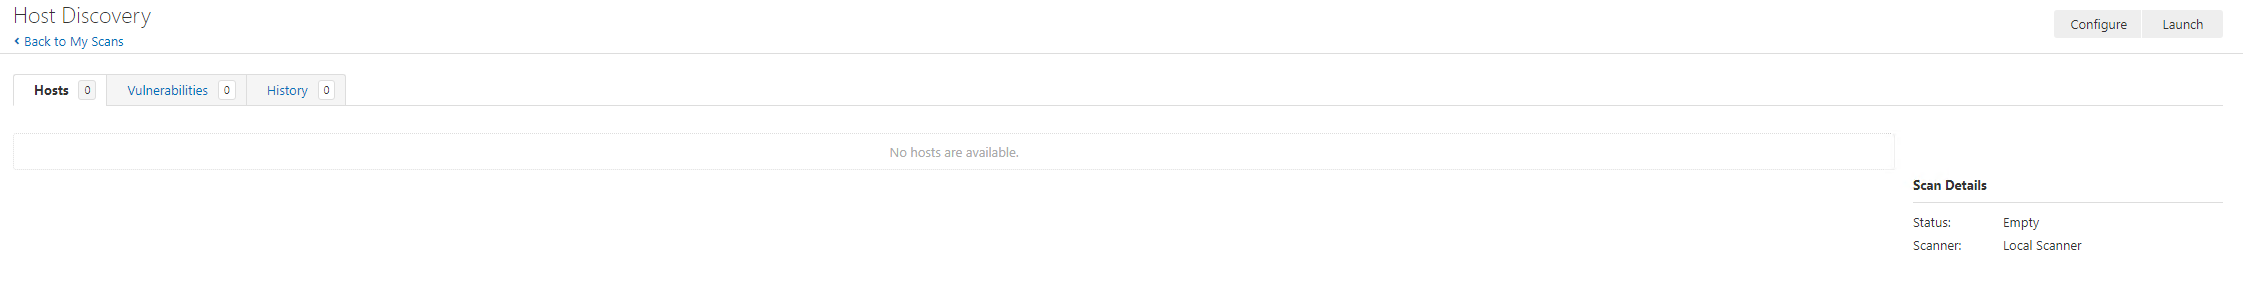
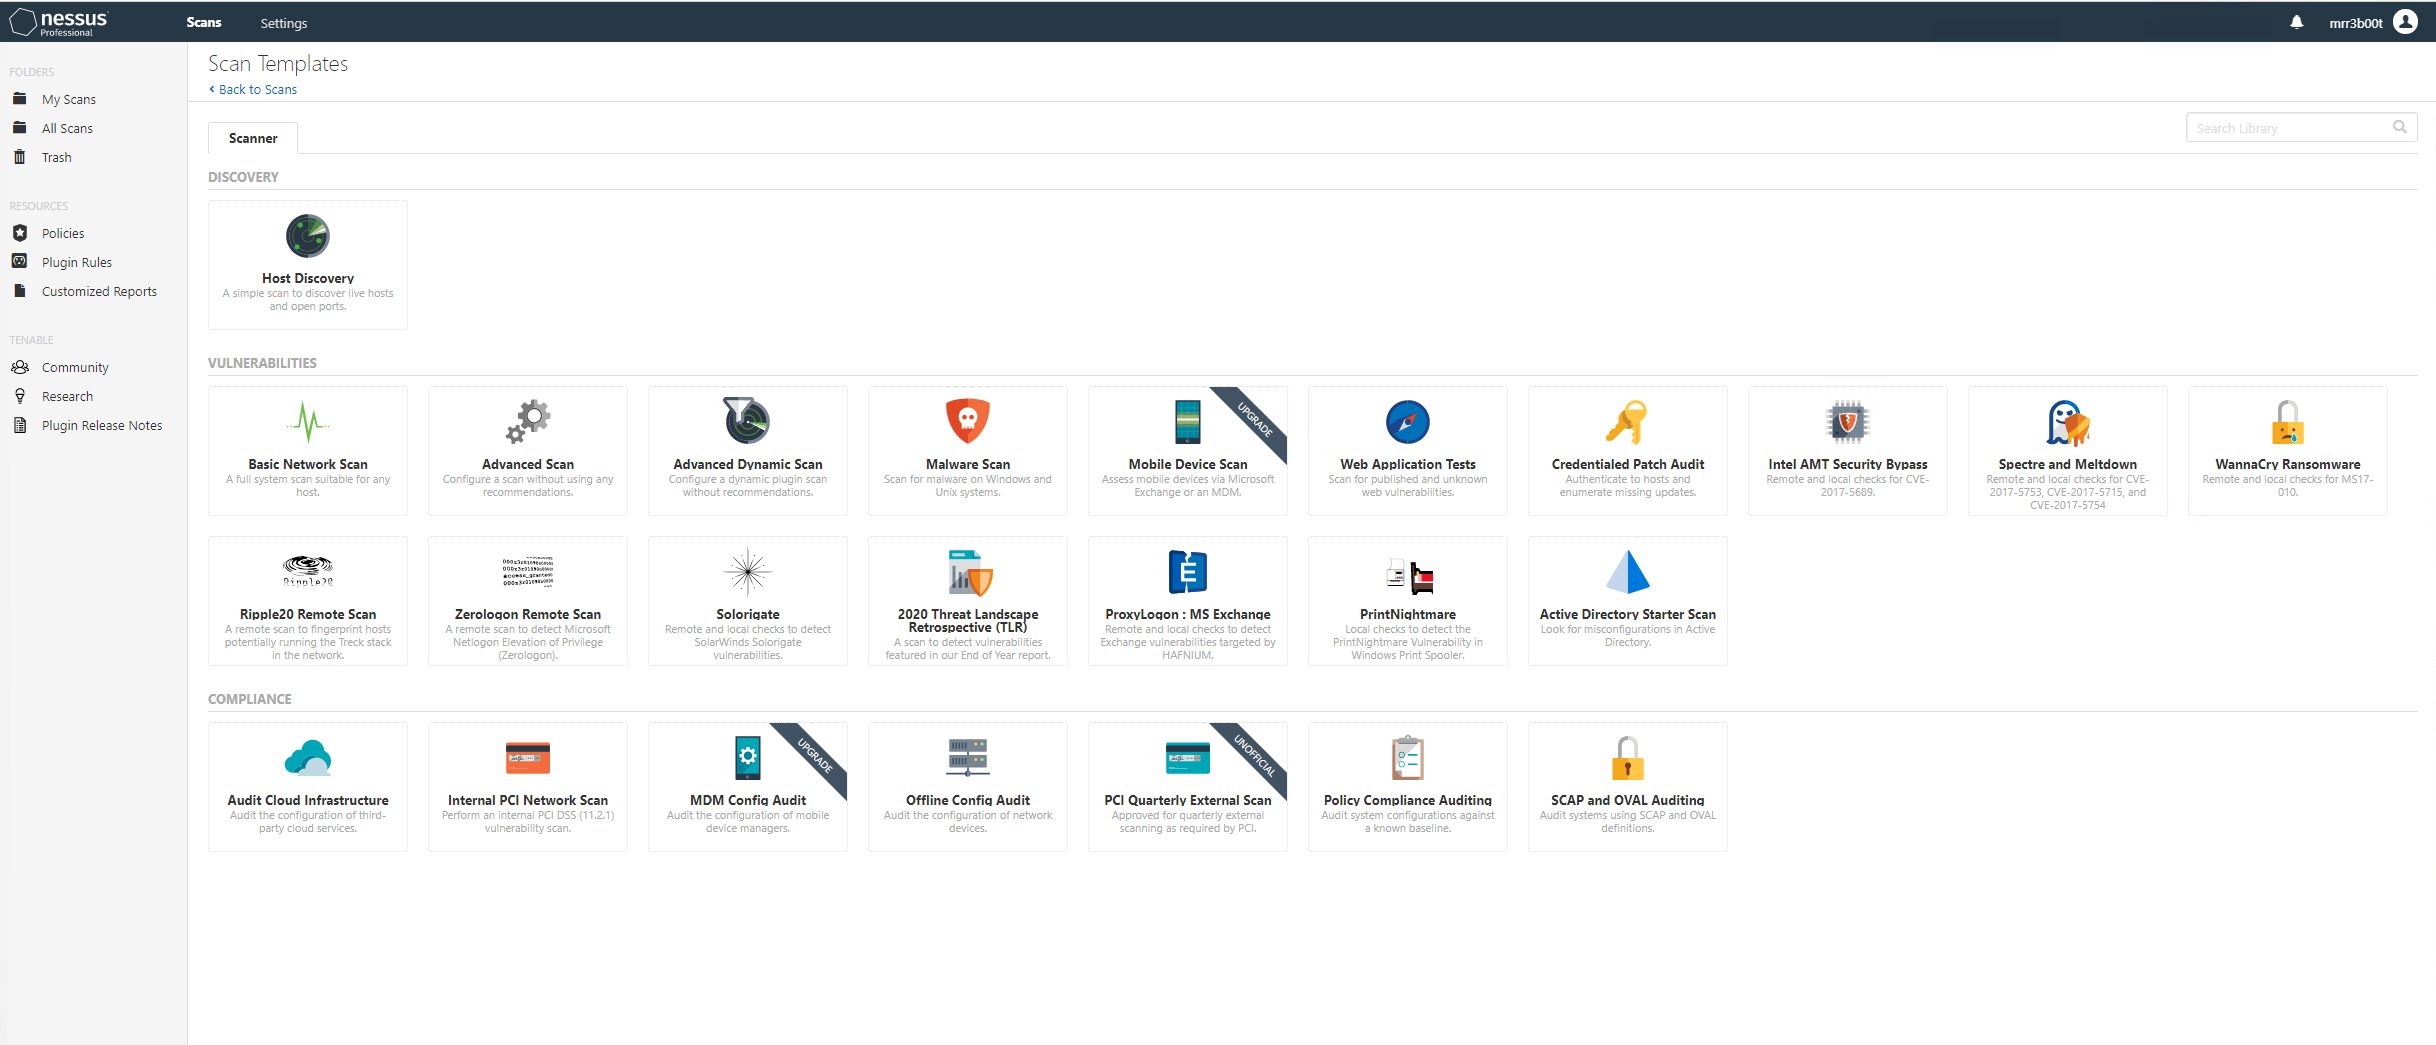
To start we are going to create a quick Host Discovery scan:
Let’s click NEW SCAN then select the Host Discovery template:
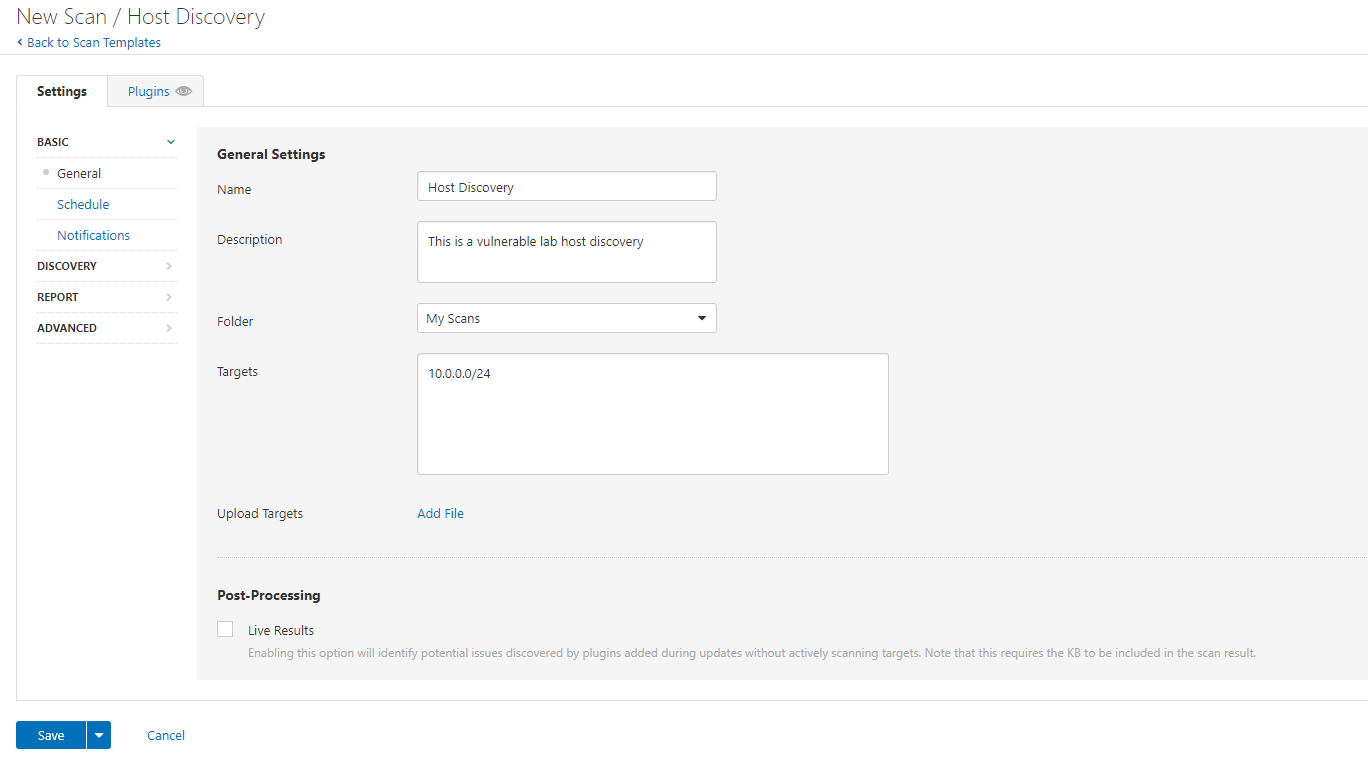
Now we need to configure this, so let’s give it a name, description and target range.
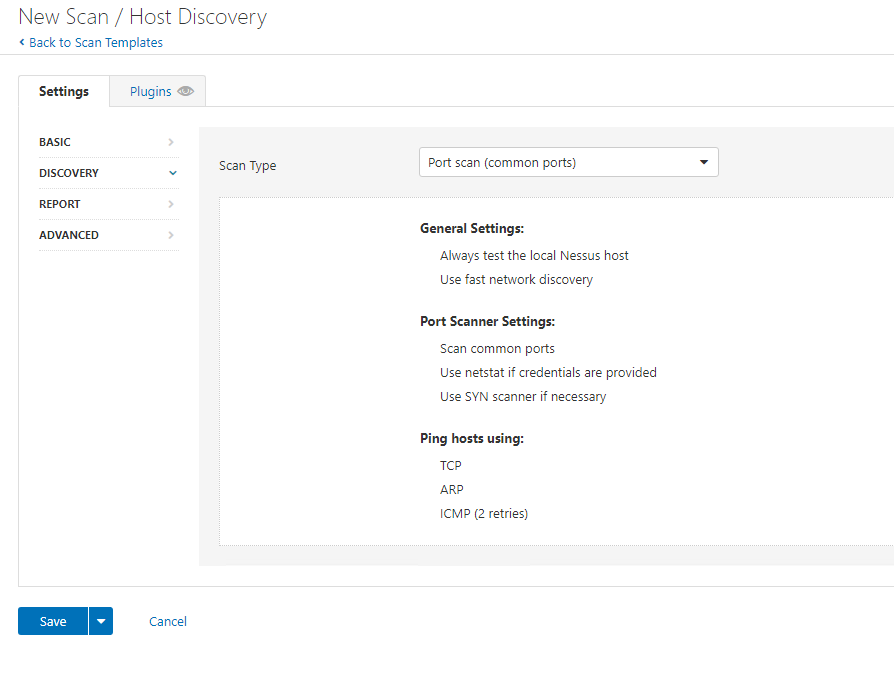
We are going to review/configure the DISCOVERY parameters:
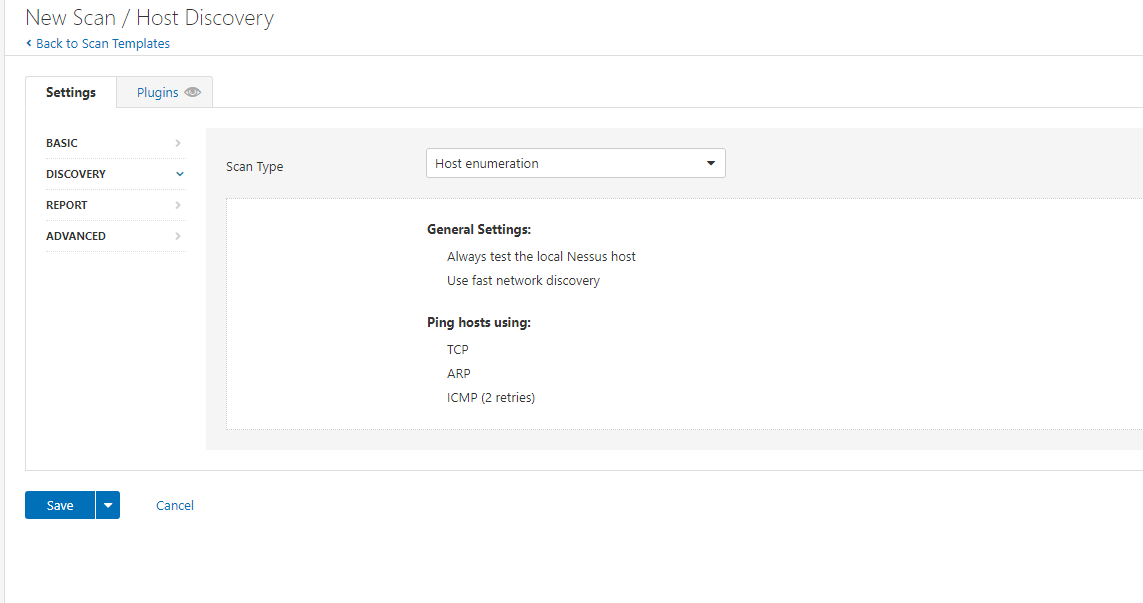
I’m going to change this to include a common port scan. As we know to discovery network assets requires a mixture of techniques. We aren’t trying to be stealthy here, our goal is to find as many assets and services as possible.
So, let’s click save, then move to REPORT:
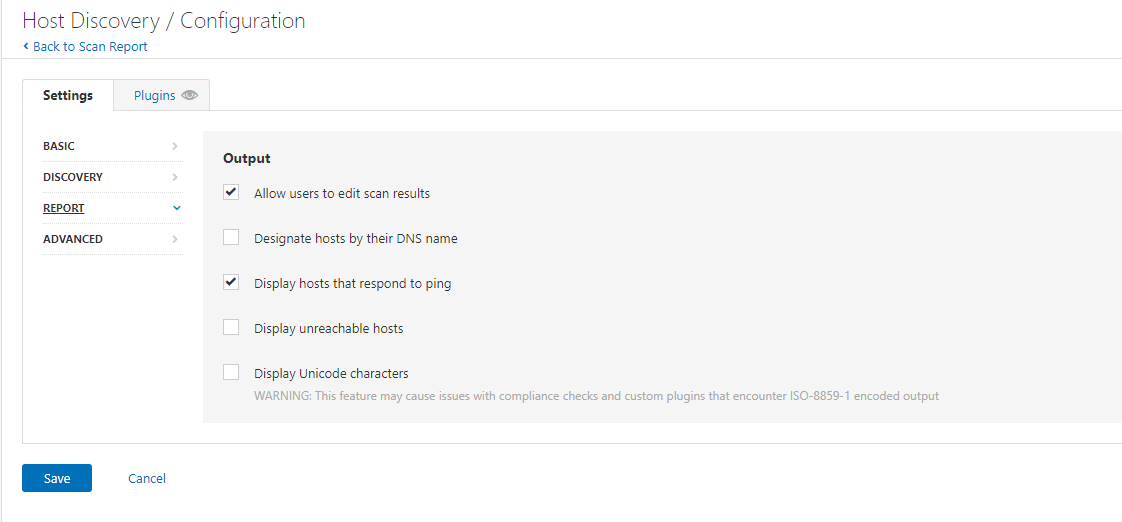
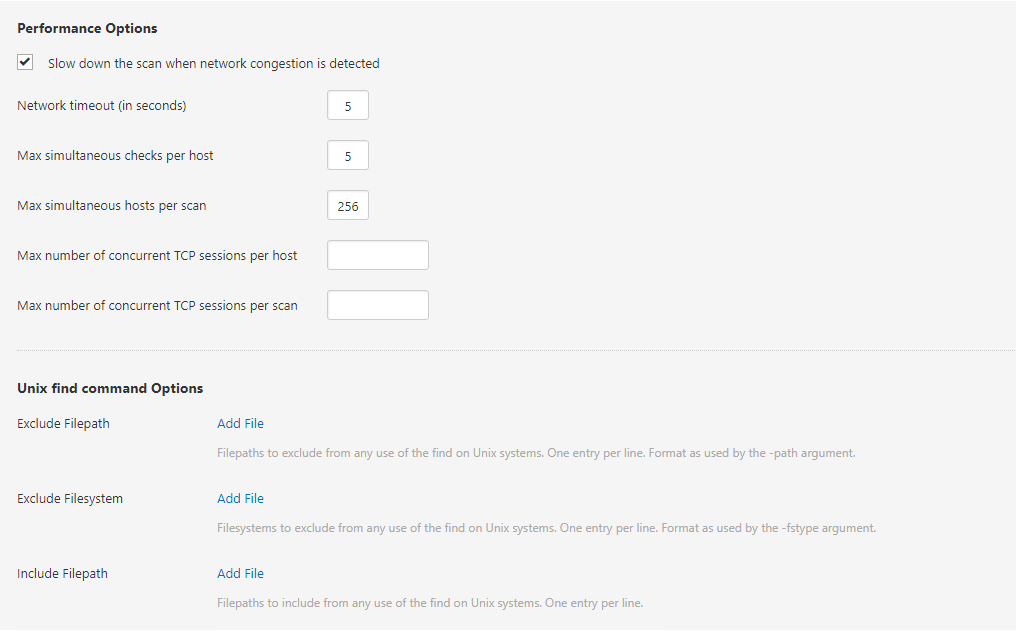
Now here we can choose some options, the main one we will probably configure here is the PING option and DNS name options. For the lab I’m going to enable reporting hosts by DNS name and then we are going to look at advanced:
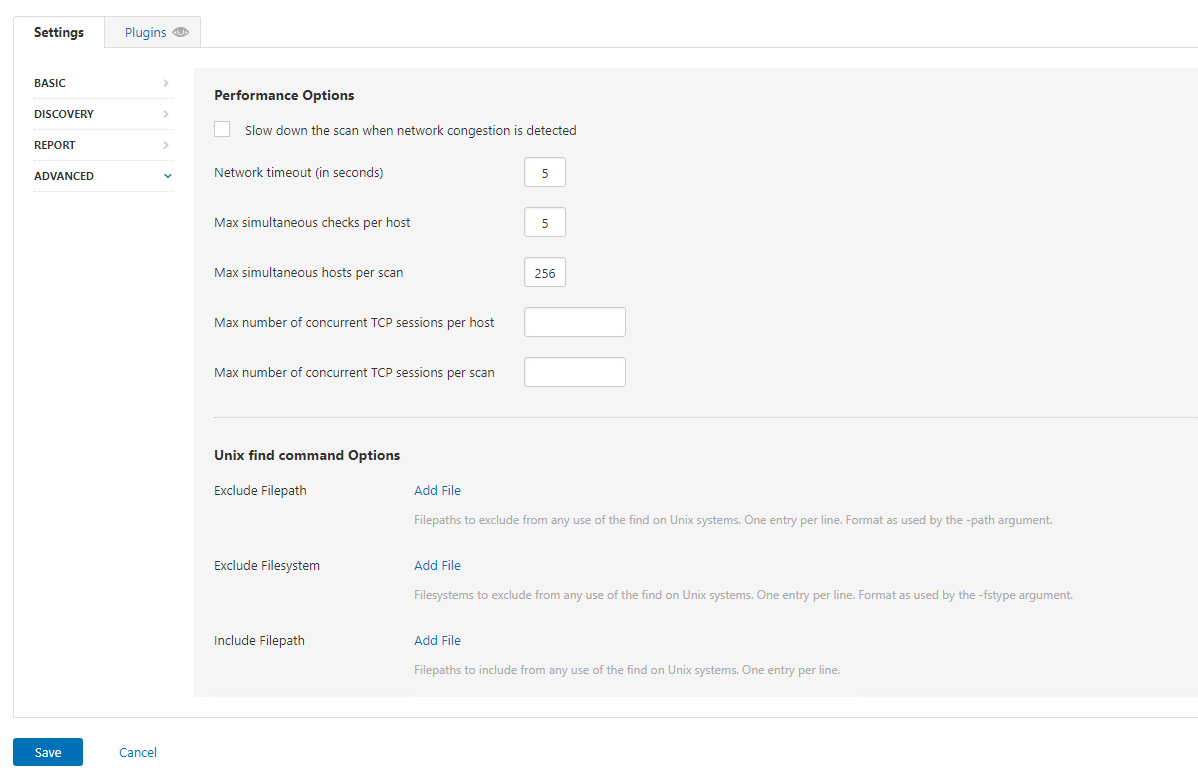
Here we have some options around scanning, we don’t know this network (Ok I do but I’m pretending I don’t), so we are doing to enable Slow down the scan when network congestion is detected:
We are going to save the options. Next, we need to run the scan:
Click LAUNCH
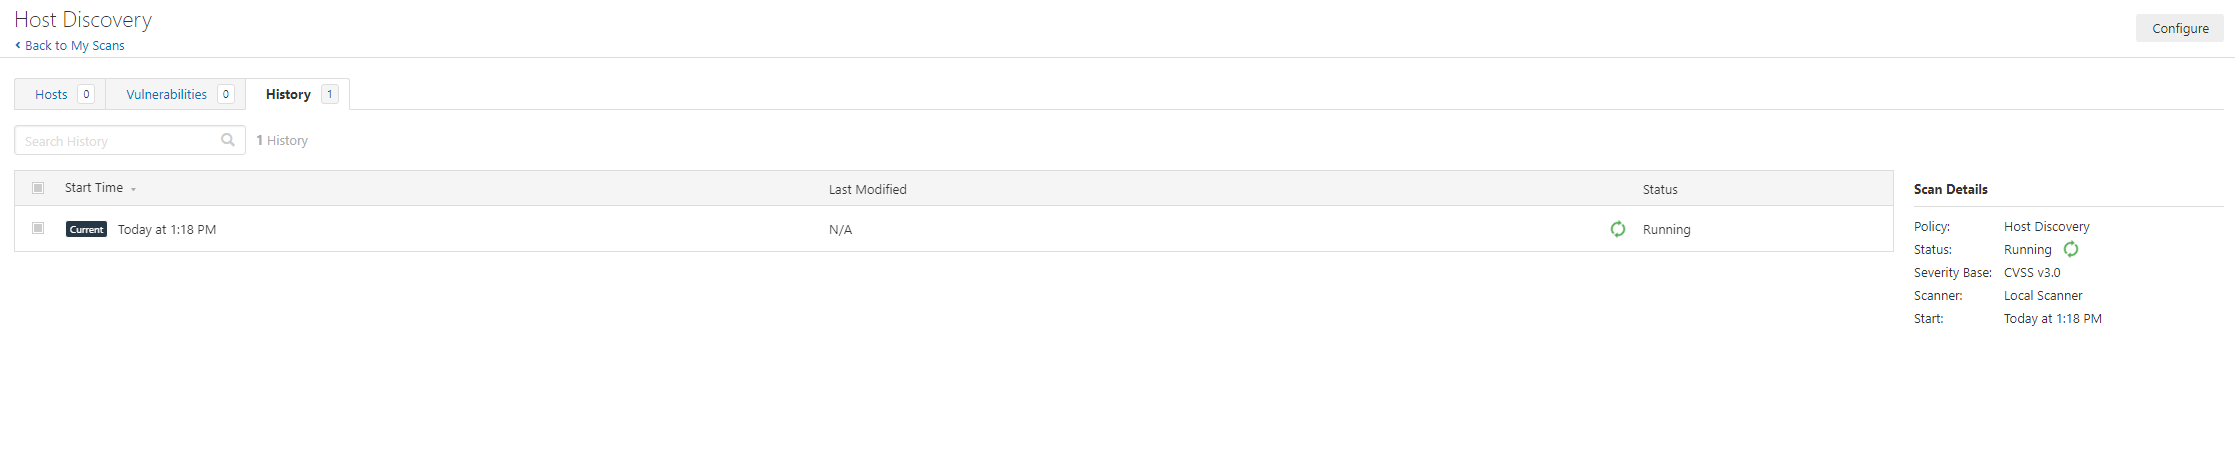
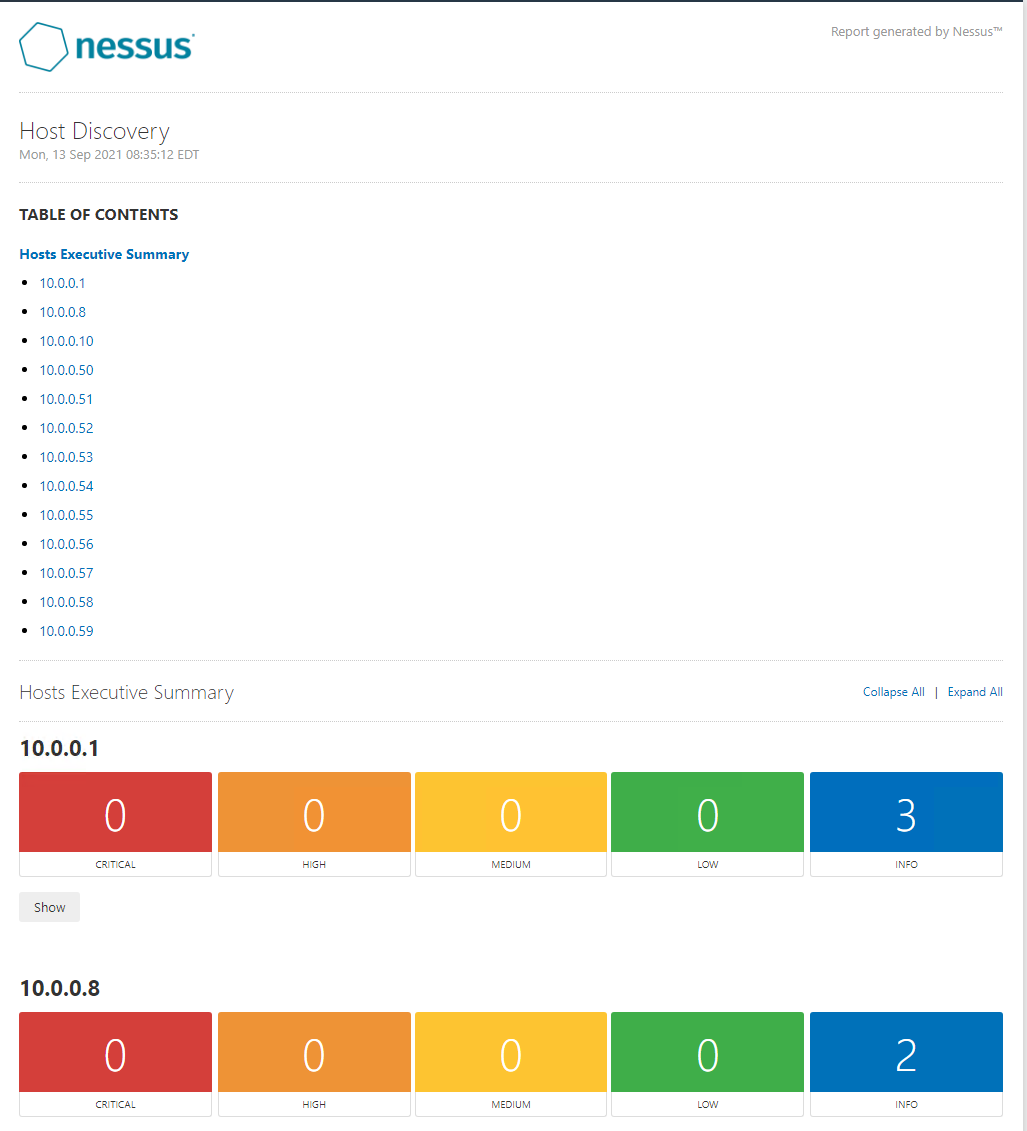
And 3 minutes later (remember this is a tiny single /24 network in a lab) our scan is completed:
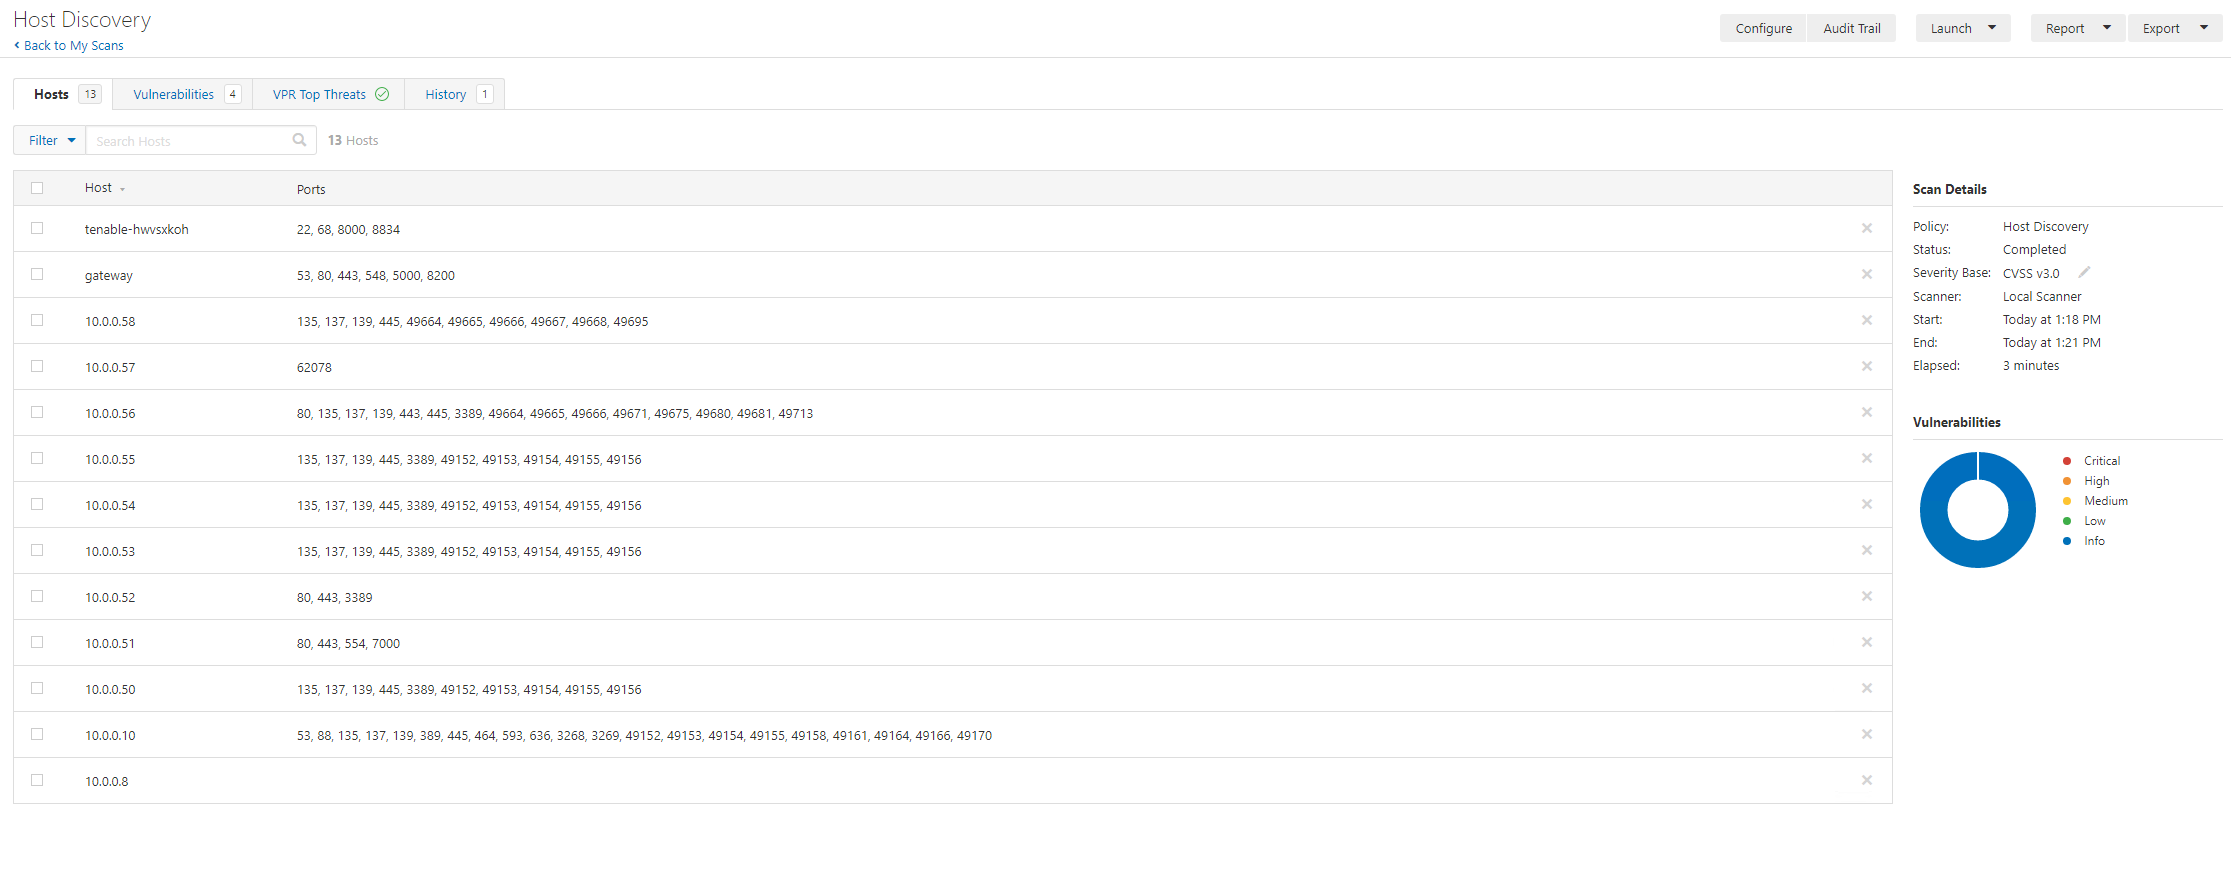
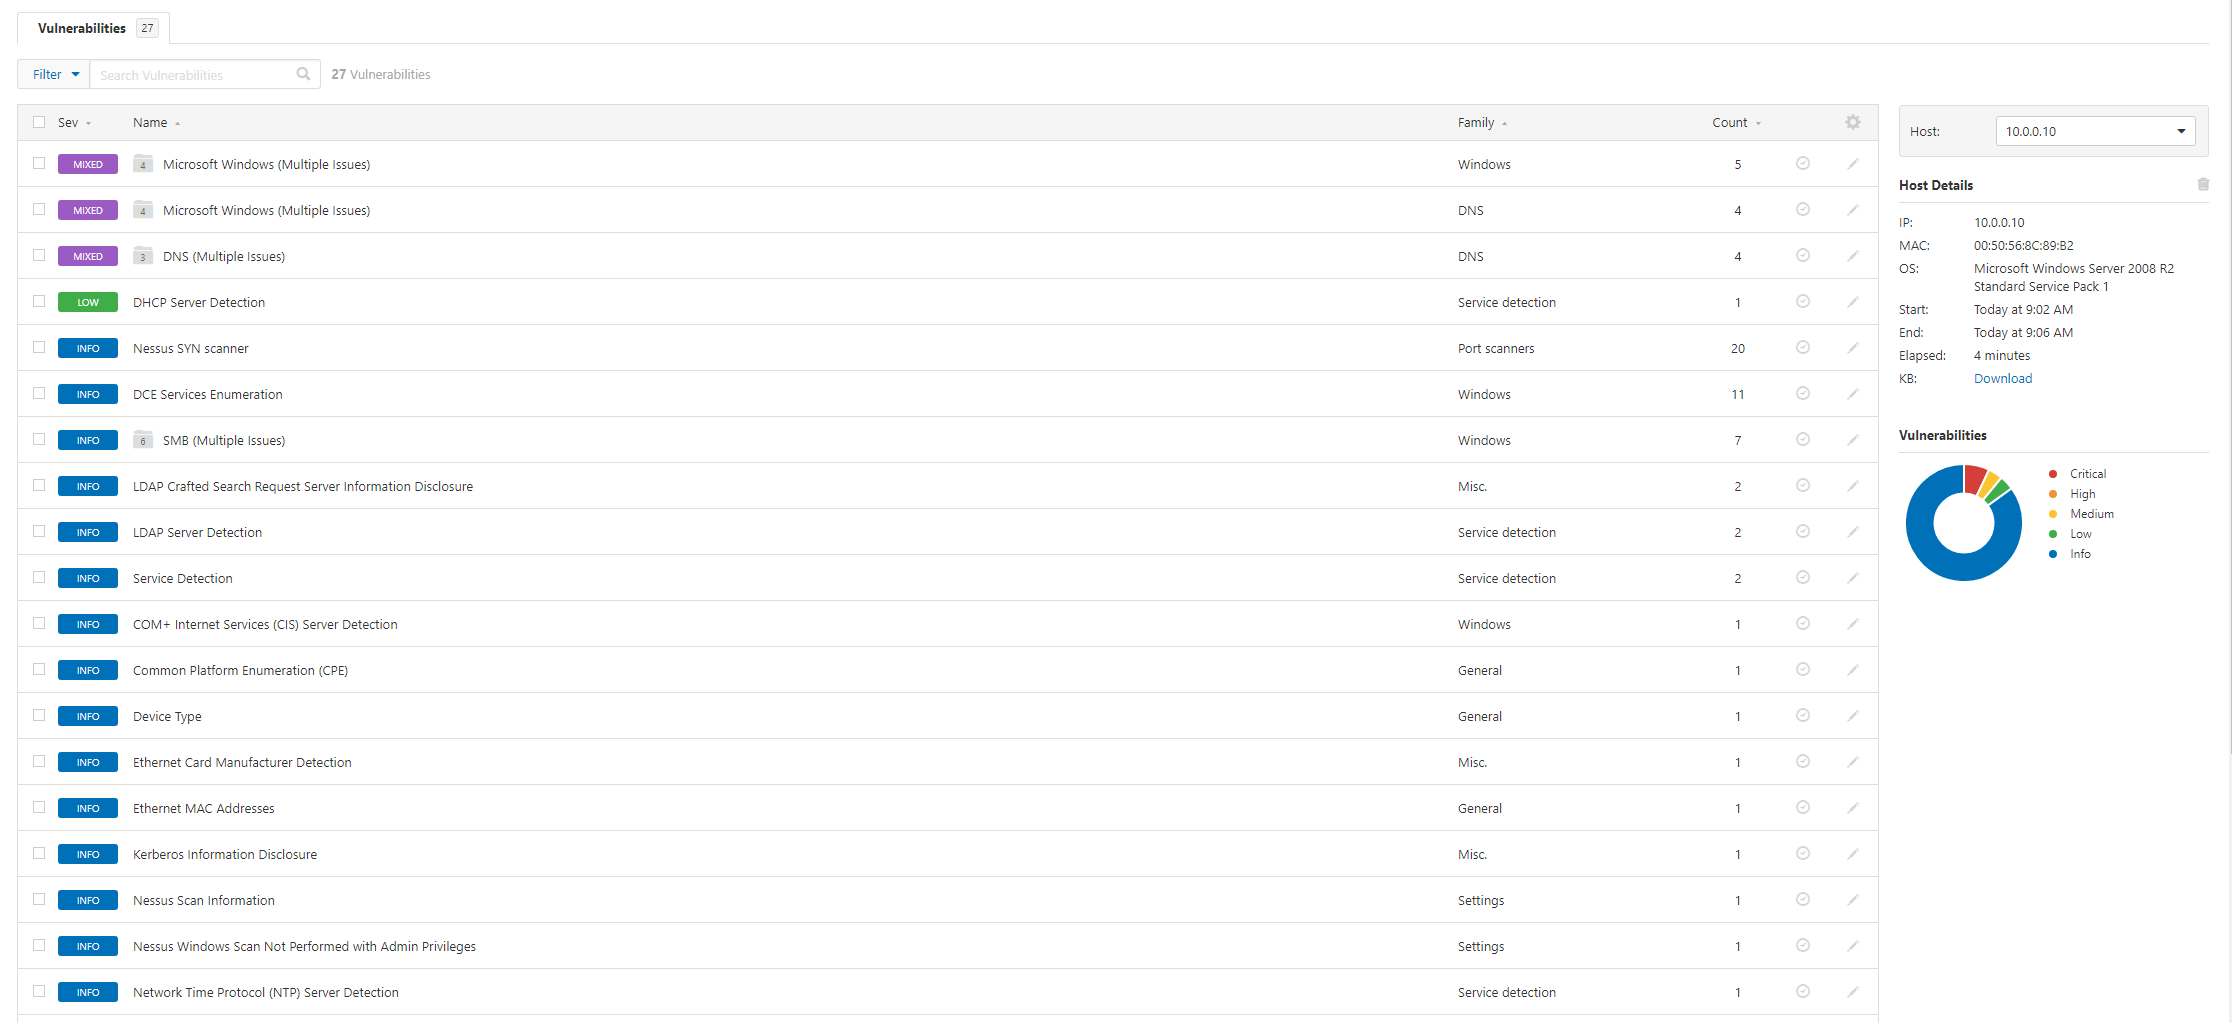
We can see here the DHCP server in the lab is giving out a DNS server that is unaware of the directory services reverse lookup space (we can see there is a domain controller running on 10.0.010 – look at the ports, 53, 445,389,636,88, 3268, 3269 screams domain controller). This is because the lab didn’t have a reverse dns lookup zone configured.
We are going to disable the report hosts via DNS flag so that IP’s are reported. Now this area is one that can be interesting so work with the report consumers to work out the best approach (the lab example isn’t common; you would usually get a domain linked DNS server provided):
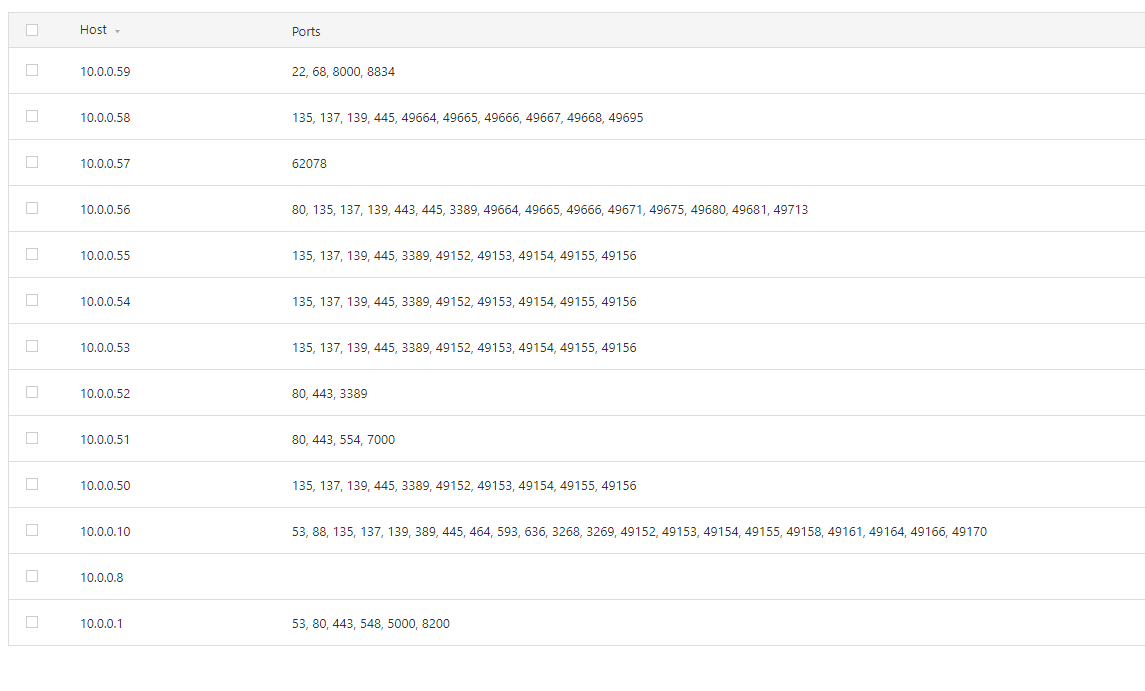
Now we’ve discovered some hosts we have some options. Our next step is to move to an unauthenticated scan of the range. We do however have a choice; we can configure a scan for the whole /24 or we can use the discovered targets. We are going to go with option 2 in this instance. Let’s export the hosts:
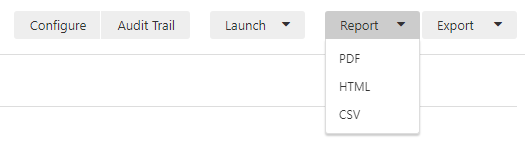
Select CSV
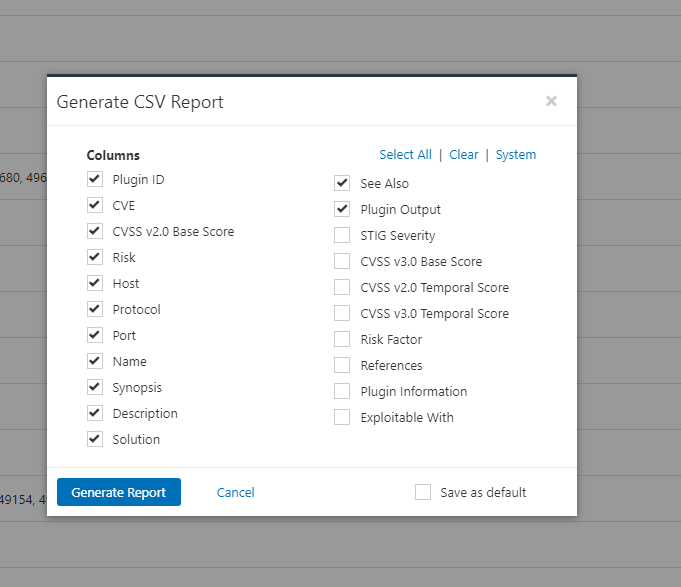
We don’t need all the details for this but it’s useful from a reporting pov to export these:
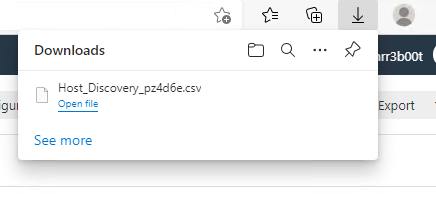
Great we now have a CSV export. This output is one of the more useful ones in this instance. The PDF and HTML outputs in this instance aren’t going to blow you away:
We have run a host discovery with common ports (now please bear in mind, discovery of assets and the constraints/parameters need to be understood).
Consider:
- Network Topology
- ACLs
- Host Based Firewalls
- Network Segmentation
- ICMP
- ARP
- Protocol Impacts
- IPS/IDS
For this run through we are going to continue with this list:
| 10.0.0.1
10.0.0.10 10.0.0.50 10.0.0.51 10.0.0.52 10.0.0.53 10.0.0.54 10.0.0.55 10.0.0.56 10.0.0.57 10.0.0.58 10.0.0.59 10.0.0.8 |
Basic Network Scan
Now Let’s create a BASIC NETWORK SCAN by navigating to My Scans then clicking New Scan:

We select Basic Network Scan:
![]()
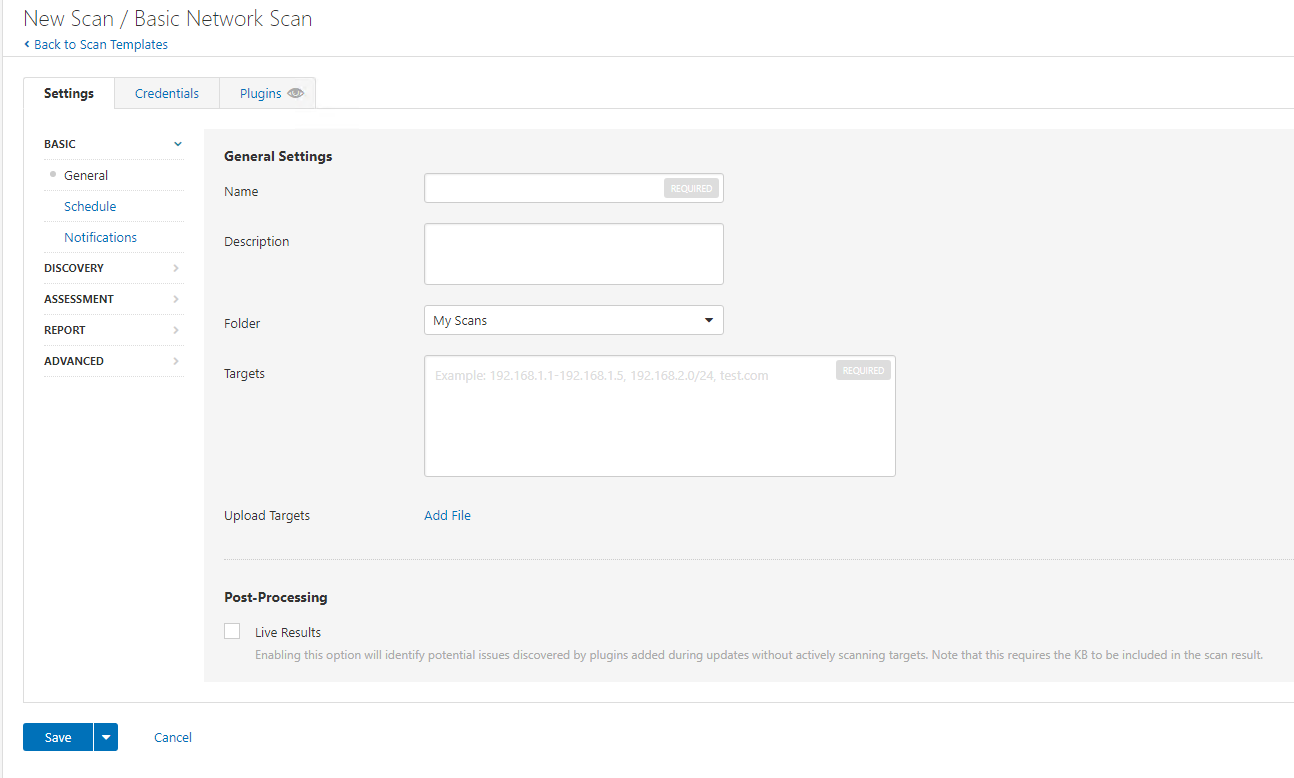
Now we are going to enter the details:

For this scan we are going to do full port scans:
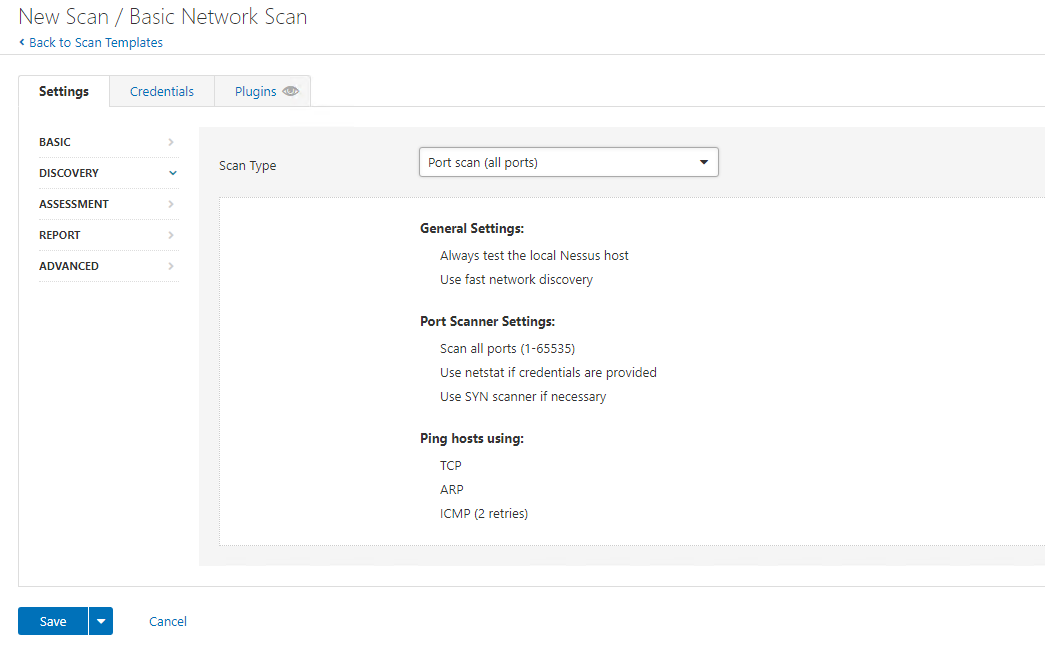
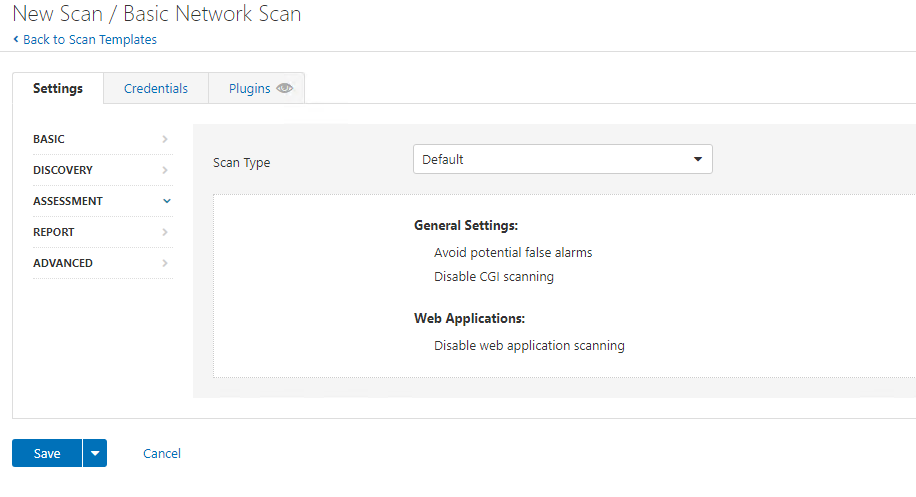
We are going to leave assessment with DEFAULT:
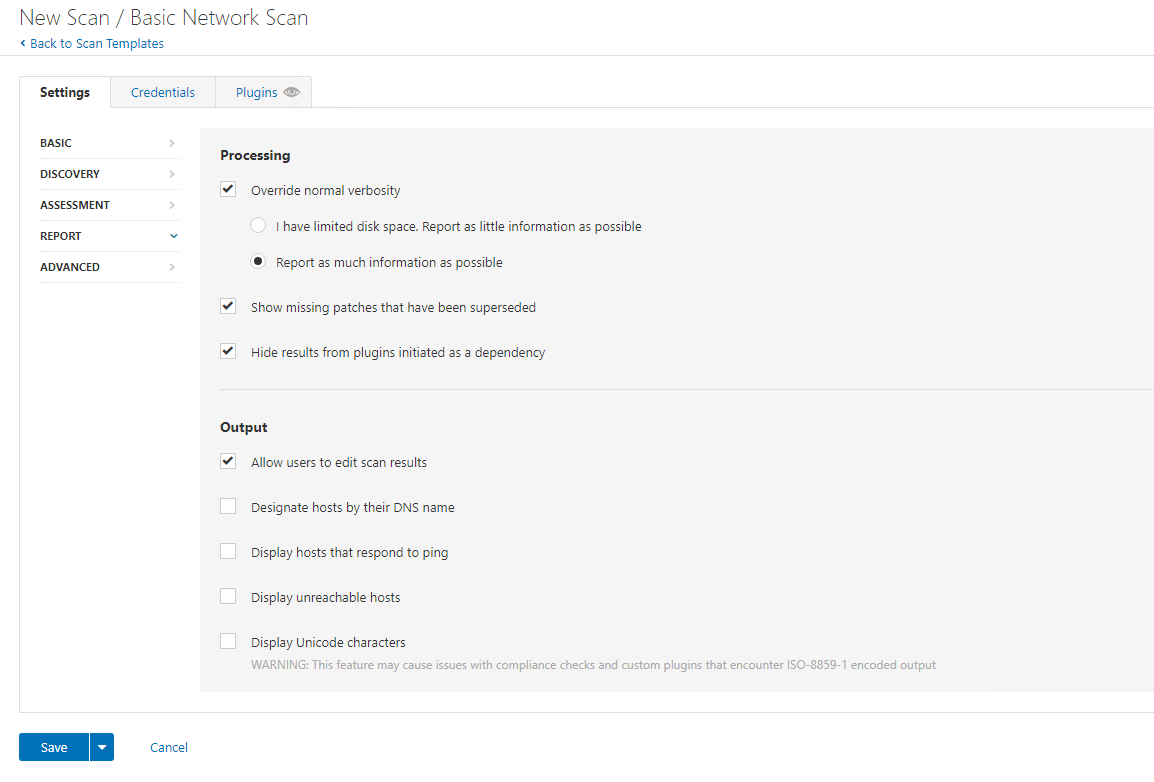
On Report we are going to configure Override normal verbosity and report as much information as possible:
And we are going to leave the scan type as default. Again, tune this configuration to suit your network environment and risk appetite.
We are now going to run the scan:
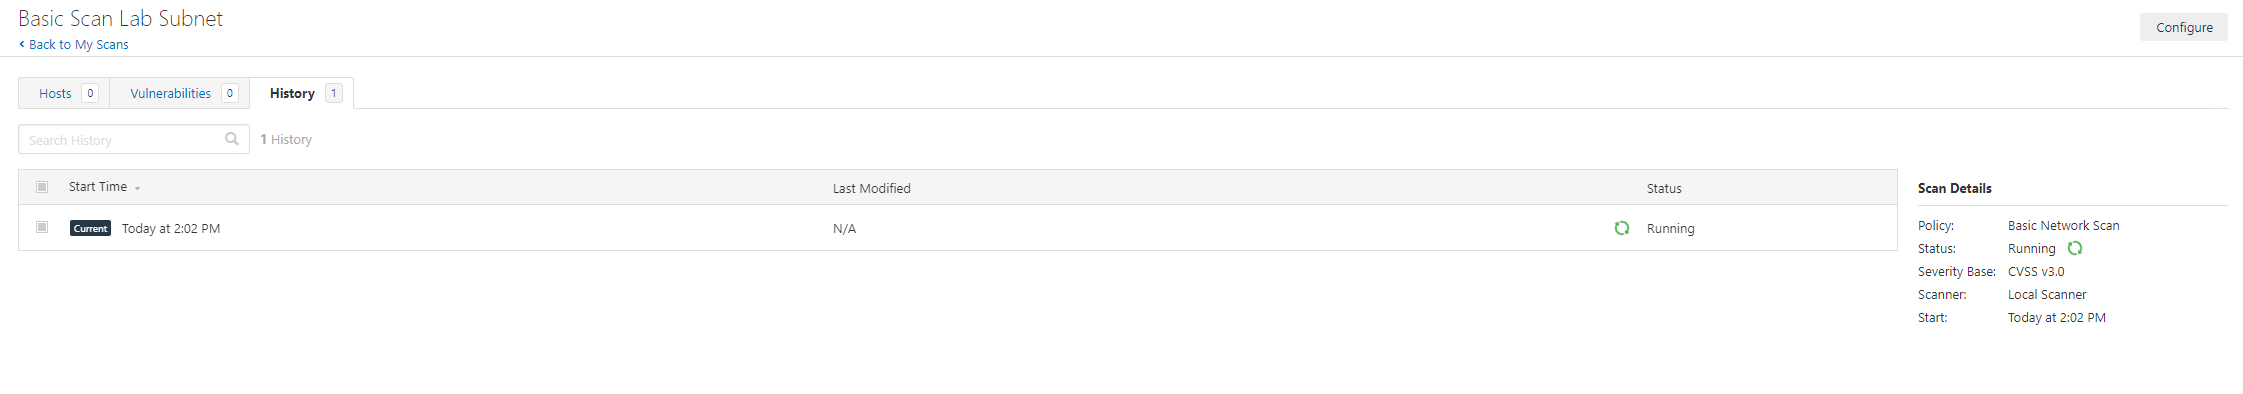
Now that’s running we can monitor this, there’s views of HOSTS and VULNERABILITIES:
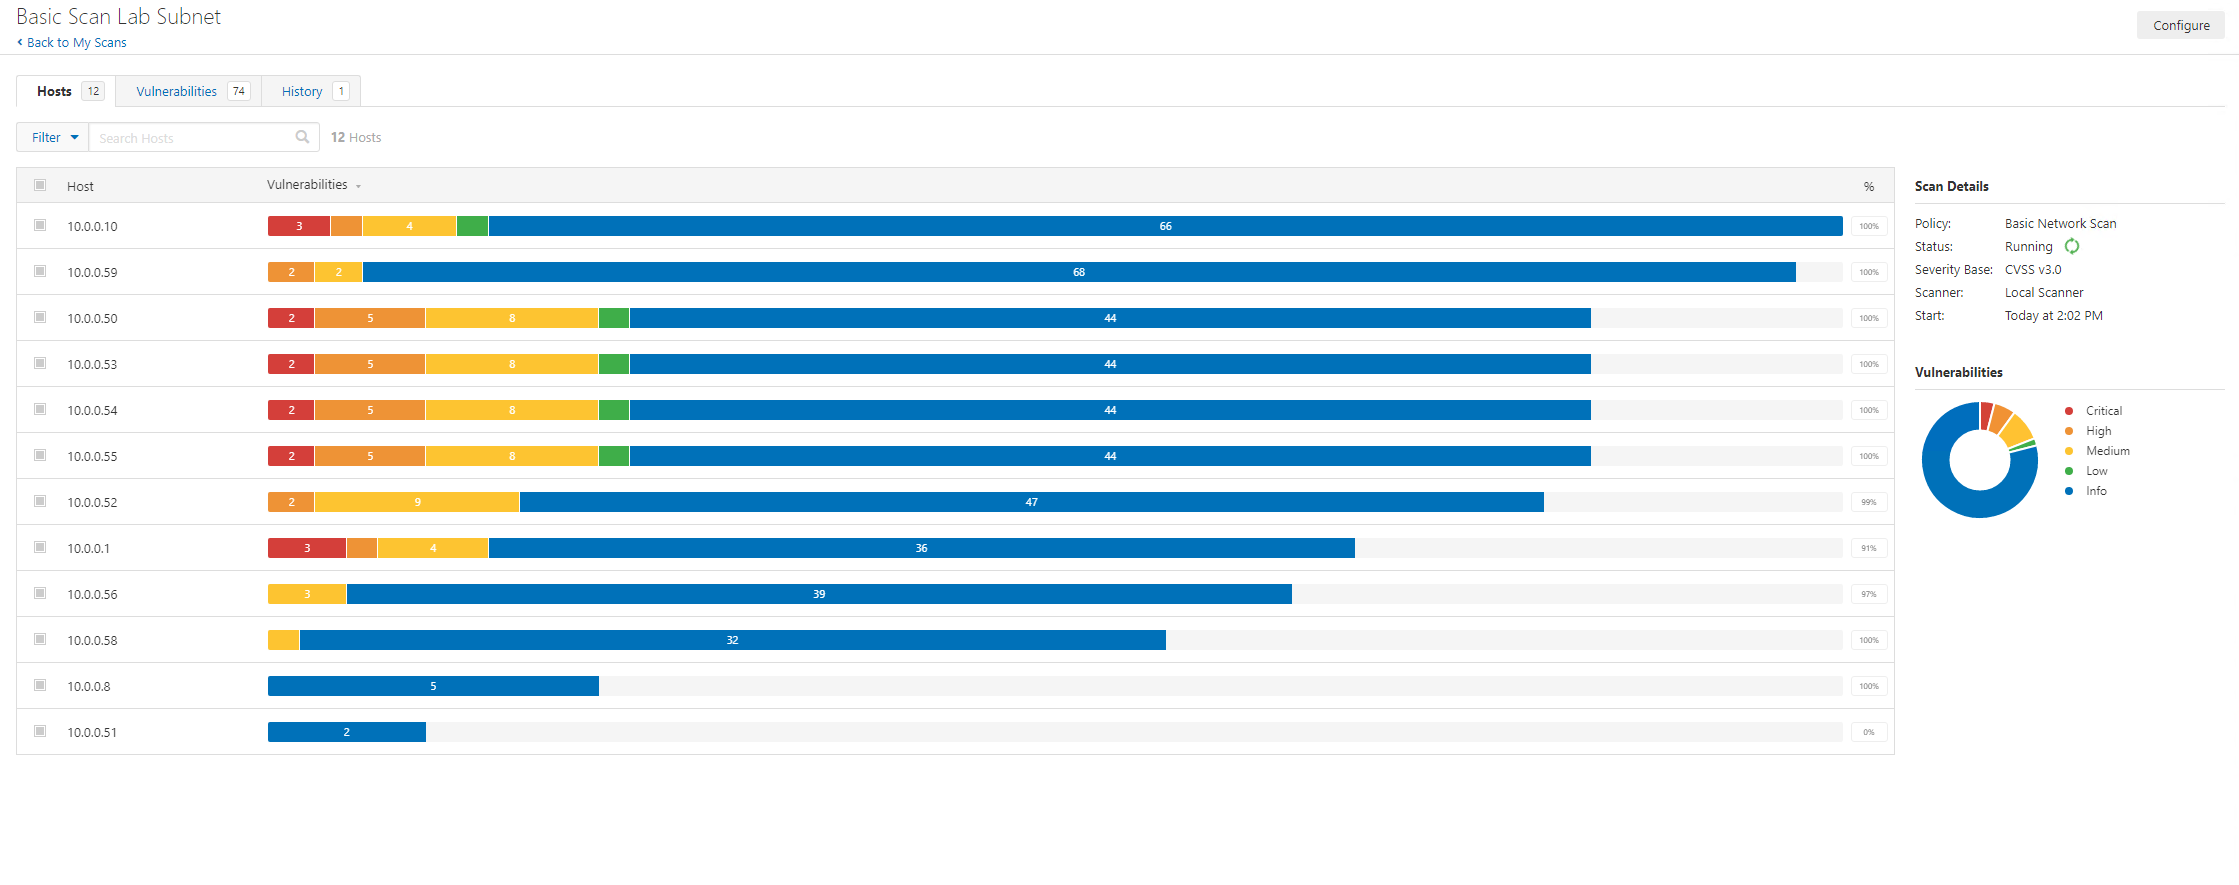
The scan status is shown on the right-hand side.
After around one hour, the scan has completed!
Yay job done, isn’t it? Nope. Not so fast. That was just an unauthenticated scan, but also it needs to be read and understood. This is the part the world needs to wake up to a bit, security management takes time. But before we start analysing the outputs let’s kick off another scan, this time we want to authenticate. Here we create a new scan, this time using the Credential Based Patch Audit scan template (you can add credentials to more than this template):
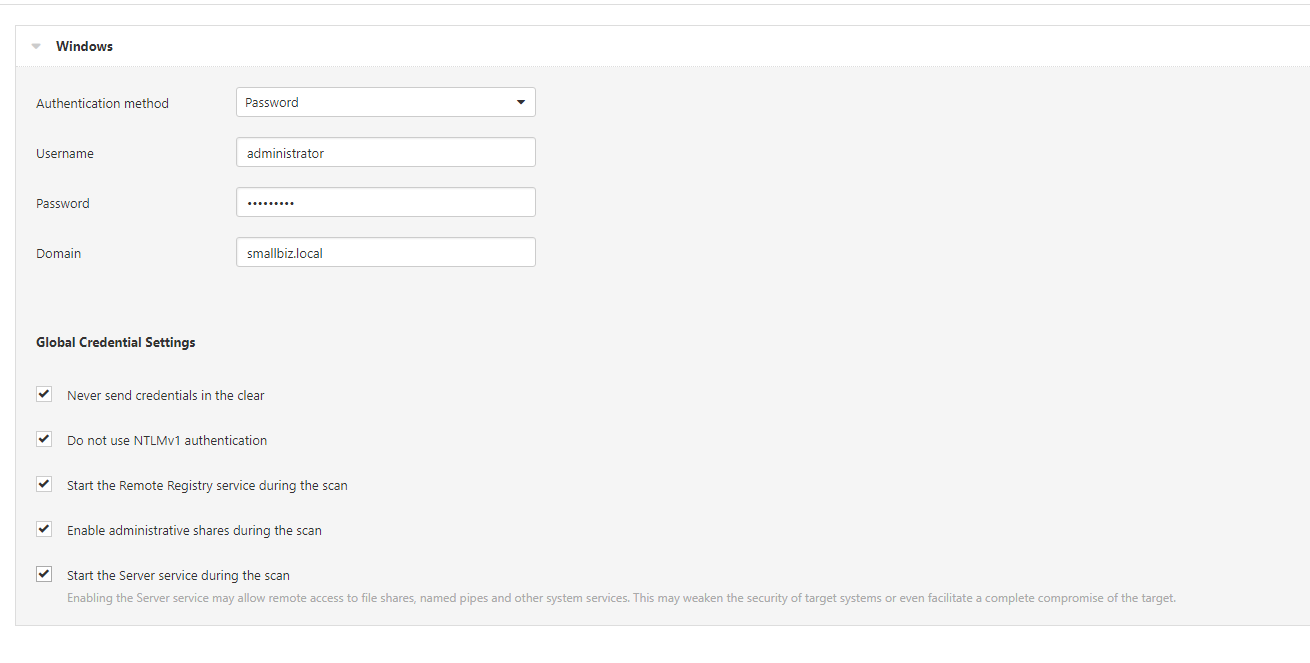
We are going to provide the scan domain admin credentials. You need to consider the scan authentication process, the security of the scanner but also the levels of access required. To audit active directory domain controllers, we will need local admin right on the domain controllers. Authentication is an area that can take far more time than people realise. For scans to be successful the targets must also be in a certain configuration. Workgroup machines are also ‘fun’ to configure and to scan, they are often painful to access let alone to scan.
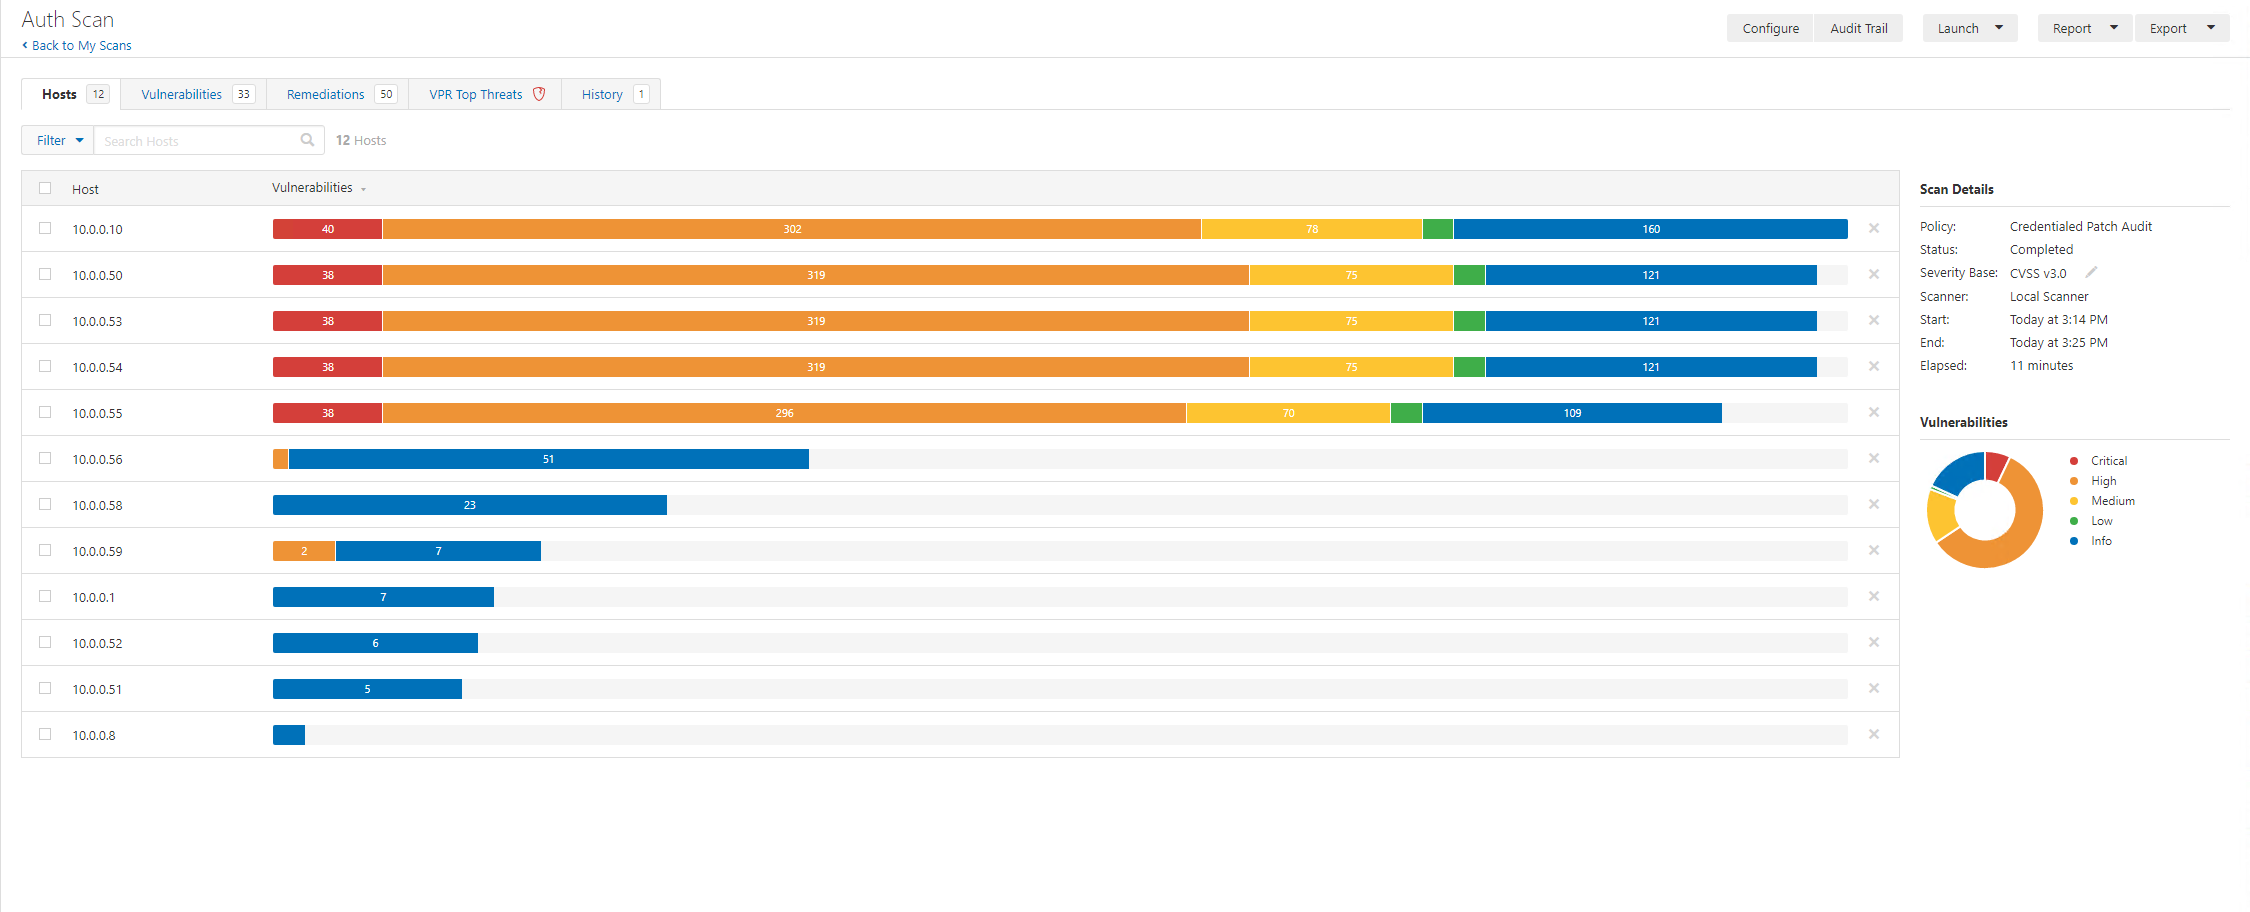
This authenticated patch scan (common ports) tool 11 minutes. Whilst we kick off another full range port scan, let’s start to look at the output.
We can see already this doesn’t look good. A few challenges will immediately stand out, currently we don’t really have a way of contextualising the business purpose of each host. Now we can use reverse lookups and often server names might help but in some orgs the names aren’t meaningful. Instead, we would need to either, contextualise with other data (this could be from an asset management system or by speaking to someone in the ops team) or we can review the fingerprints and service makeup.
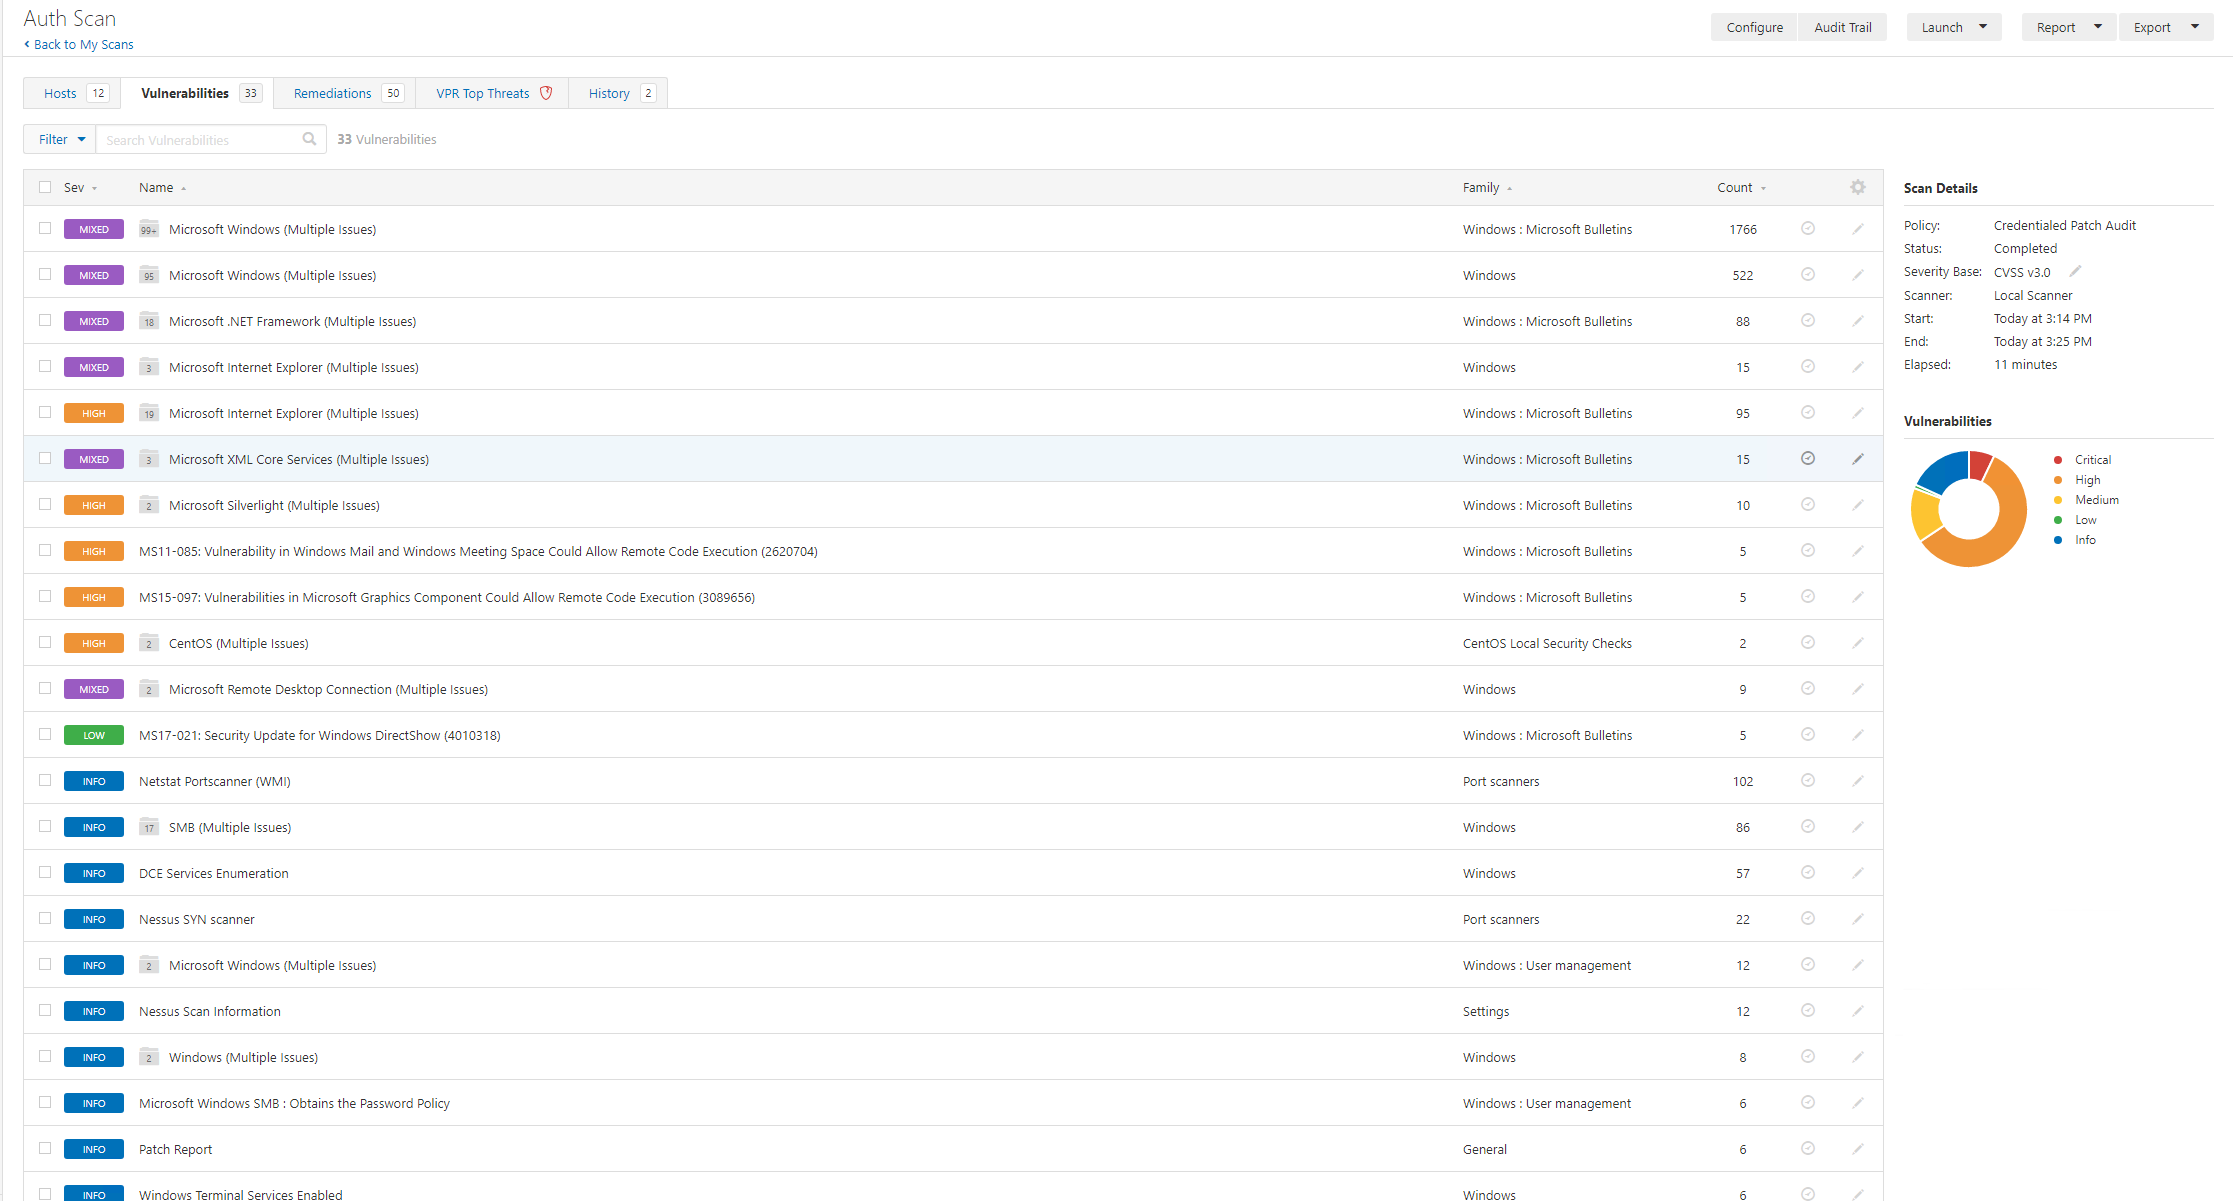
The next thing that might scream out to you is, hell there’s a lot of findings. So here again we need to consider, which hosts have a “full” picture and did any scans fail, so we can search for fail:
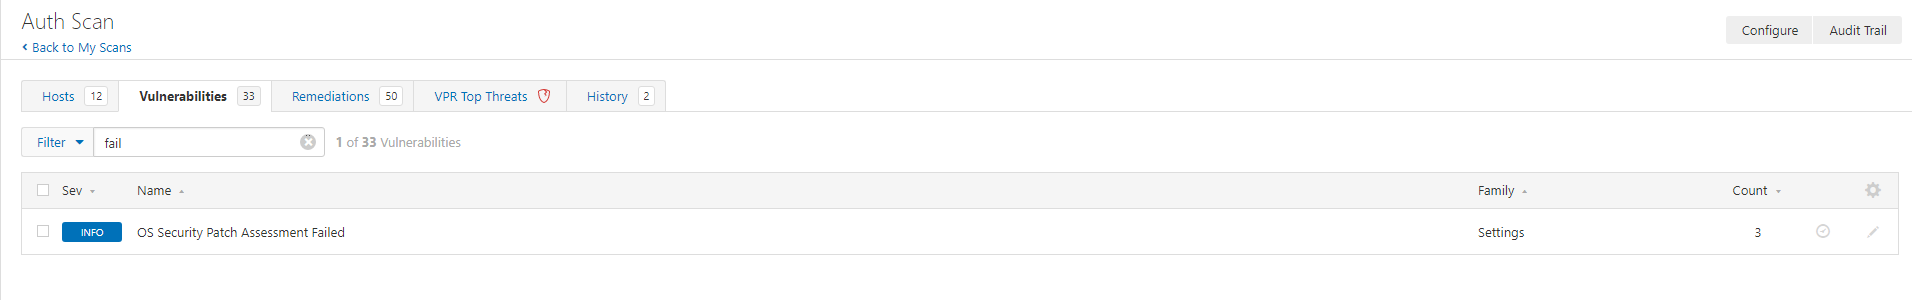
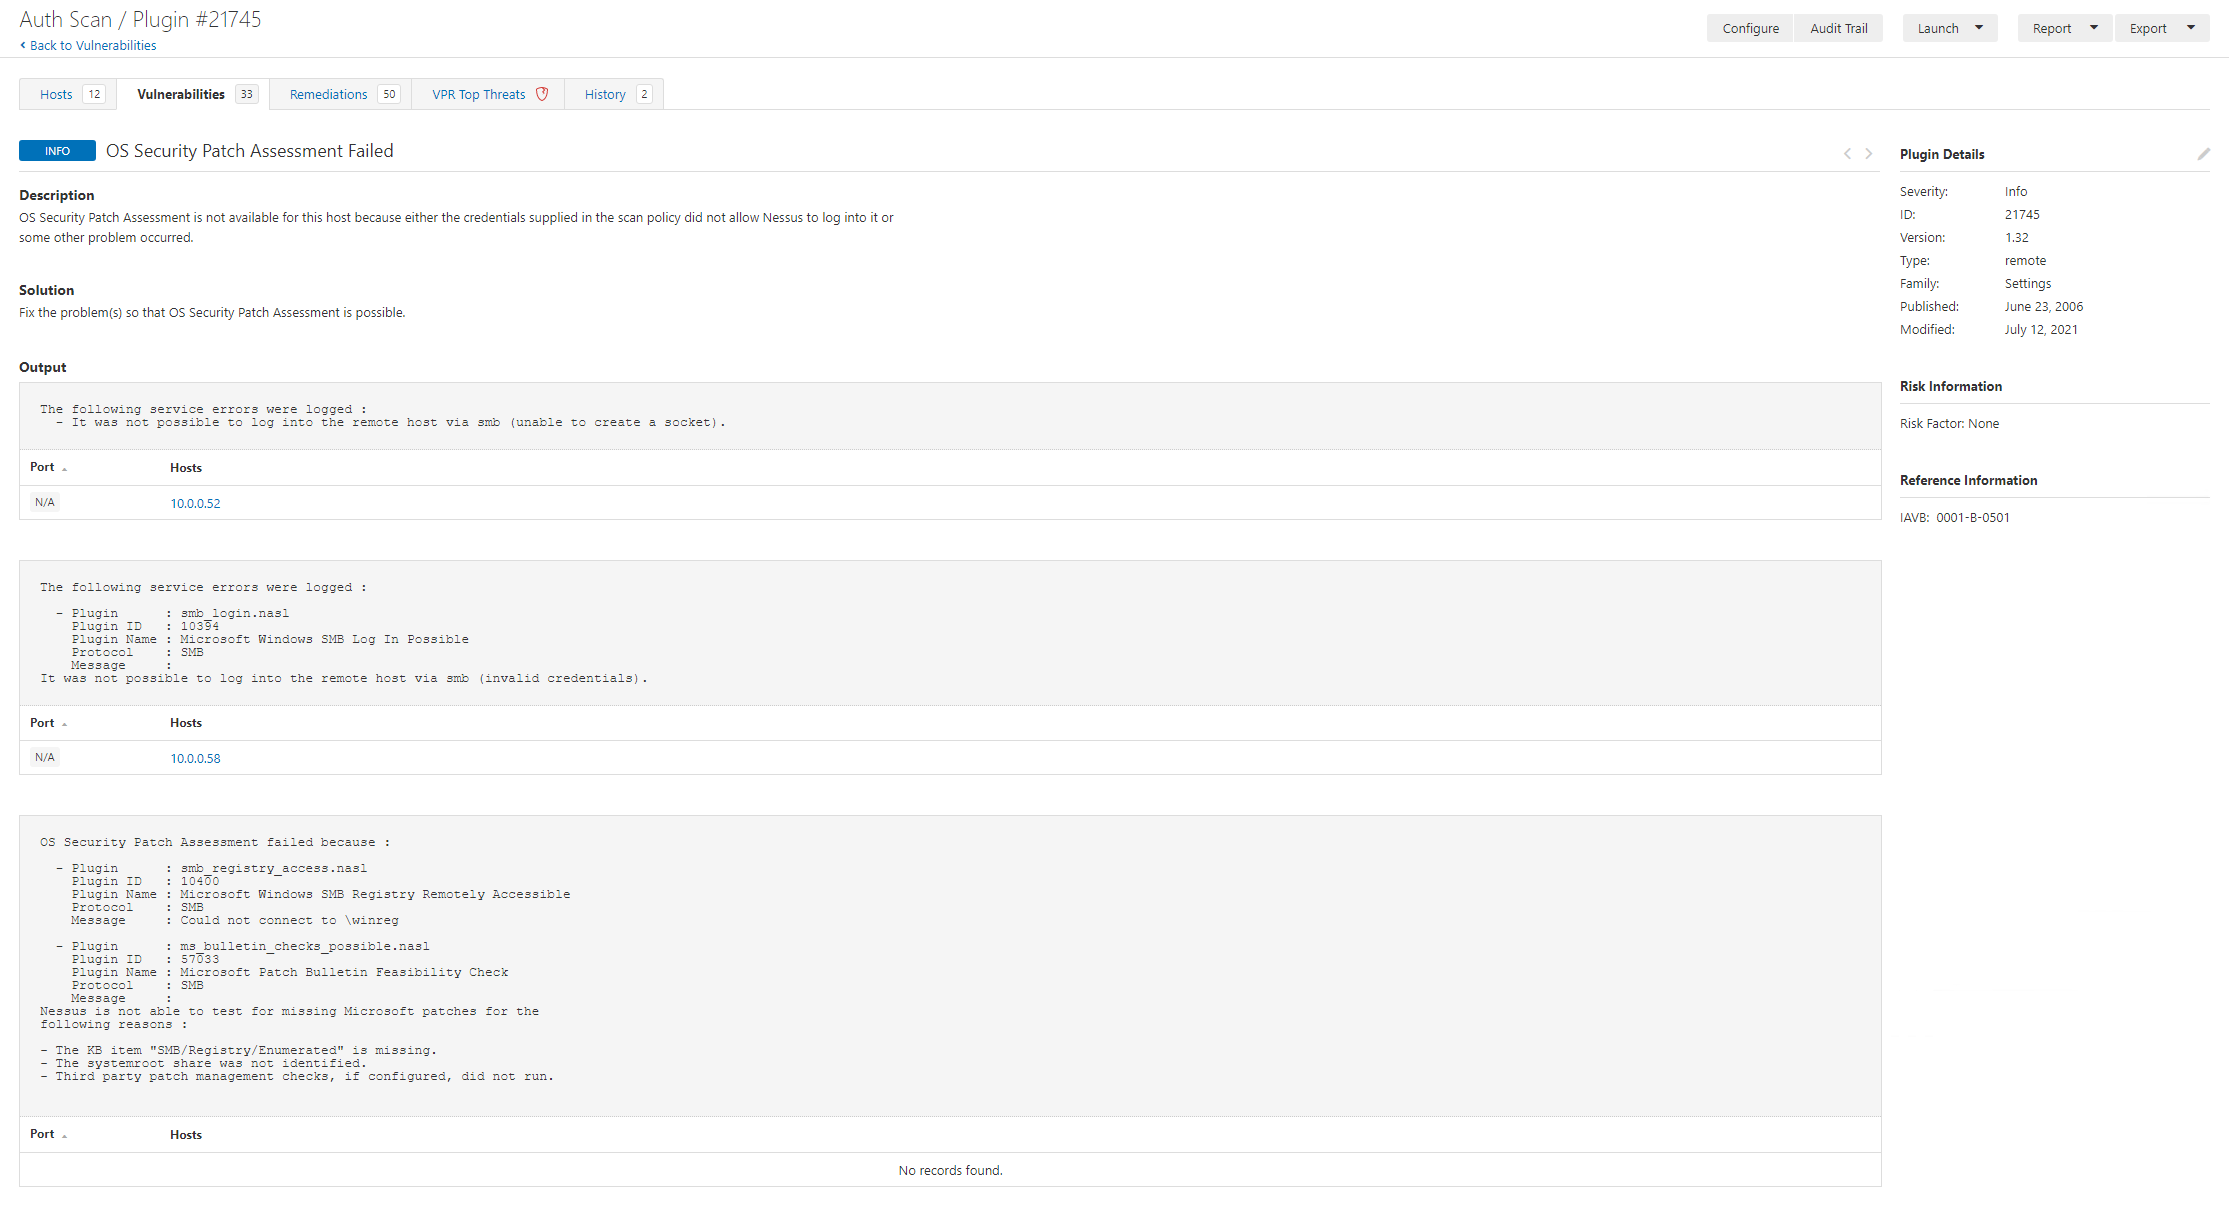
Here we have two hosts that failed to scan fully. It’s important to review the scans and identify failures as well as locating information to enable you to understand the scopes vulnerability landscape.
Nessus Scanning a workgroup PC or Server
- Ensure Remote Registry is NOT disabled.
- Configure Server SPN target validation level (if required)
- Configure Local Account Token Filter Policy: reg add HKEY_LOCAL_MACHINE\SOFTWARE\Microsoft\Windows\CurrentVersion\Policies\System /v LocalAccountTokenFilterPolicy /t REG_DWORD /d 1 /f
Making Sense of it all
The easy answer to this might be “deploy patches” and there’s some features of Nessus (and other vulnerability scanners) to help this.
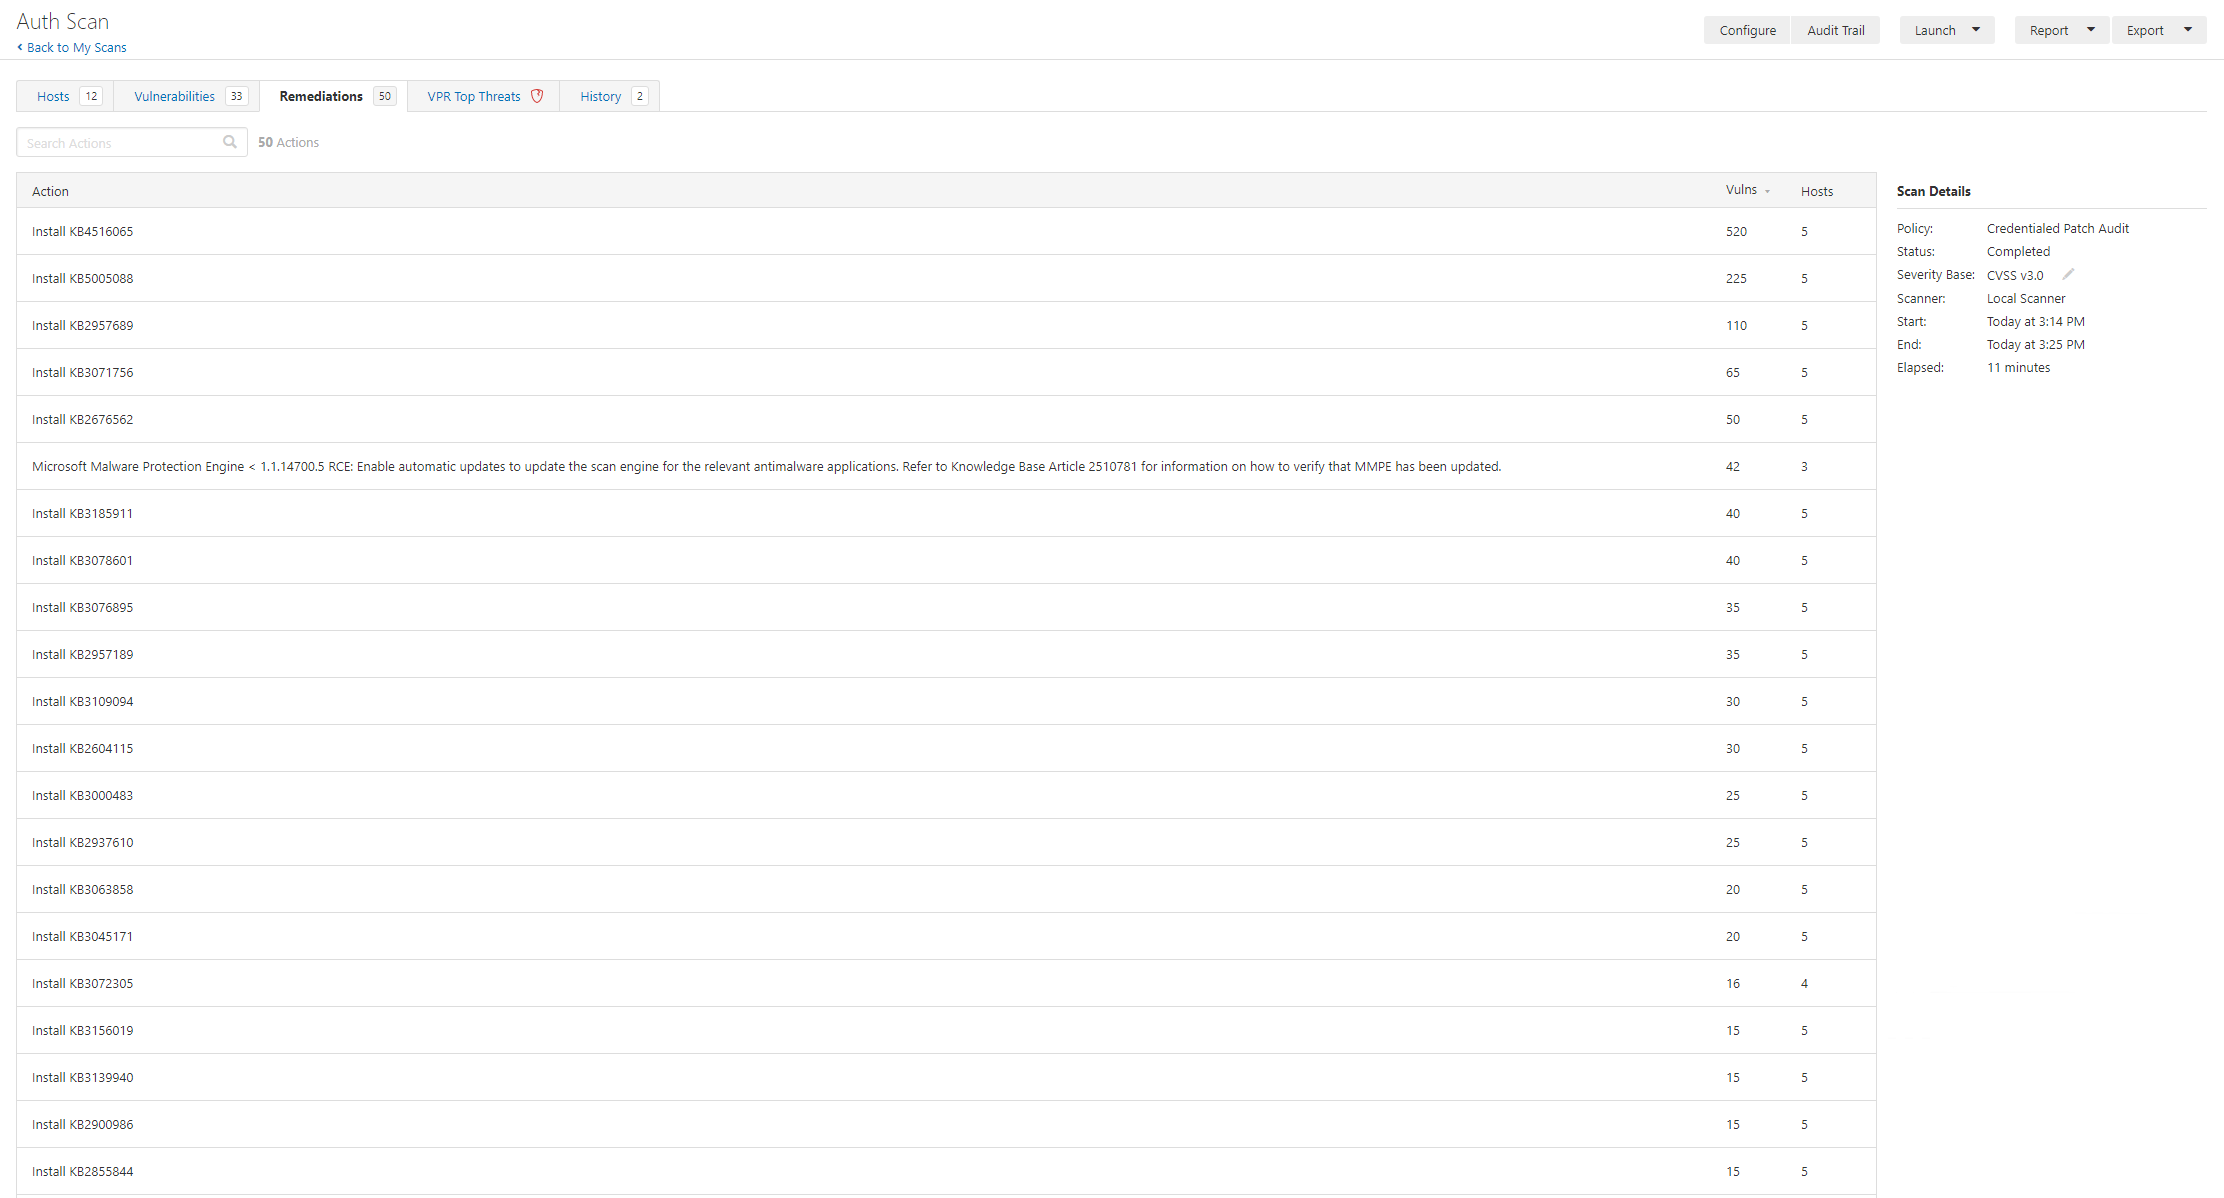
In the remediation tab there are 50 actions. We must remember though that we should consider different perspectives:
- Reviewing the environment
- Operating the environment
- Remediating the vulnerabilities
It’s important to look at context, priority, and impact/effort to fix etc. Looking at critical and highs isn’t a bad idea, but we must again remember a few things, this won’t find all vulnerabilities, there may be false positives and, exploits can be chained.
Key Considerations
Outside of understanding the vulnerability class, type, severity, exploitability, and exploitation availability information there’s a whole load of other things that are important. Now I’m sure some people will be reading thinking “that’s not my problem, but that’s exactly why the world is currently a hot mess. It’s key to ensure that both the vulnerability landscape is understood but also the business context and risk. We need to consider questions such as:
- What is the assets’ purpose?
- Who is responsible for it?
- Is it dev, test, or prod?
- Are there any special considerations?
- When are maintenance windows?
- What are the impacts of the changes that mitigate the vulnerability?
- Are there supplementary controls that can be deployed?
- How does all of this create a picture of prioritisation for remediation?
Vulnerability scanning is part of the vulnerability management process, it also ties into a much wider security architecture view (as well as obviously from an operational perspective). Fundamentally vulnerability management interfaces with a large area of security and risk management (you know part of managing technology and risk) so it’s important to consider the inputs, outputs, processes, constraints, activities, and flows.
Whether you like to cite a process from a cyberz framework (e.g. https://csrc.nist.gov/publications/detail/sp/800-40/rev-3/final) or whether you are a fan of the many many many variants of PDCA (like OODA) the reality is vulnerability management (and basically most other things in security and technology management are iterative.

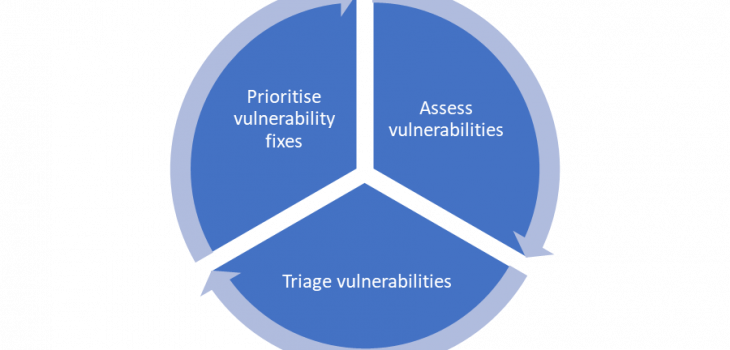
The NCSC wheel for VA is:
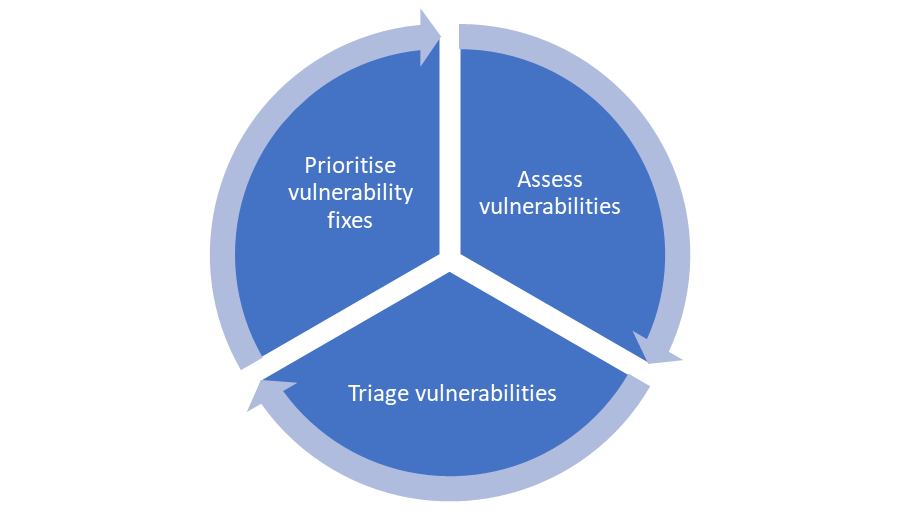
https://www.ncsc.gov.uk/guidance/vulnerability-management
The key points I’m making here is that you need to be constantly checking, reviewing, and planning. There are loads of variations on a theme. The key things to me are:
- Understand your business context
- Understand your network and assets
- Understand the risks
- Be realistic
- Communicate
- Remember this isn’t simple and it’s not solved by ‘just patching’
I hope this blog post is useful to some. It’s really a tiny dive into not just the process of scanning networks but also looking at the wider picture. It’s very easy for people to abstract and silo. I think it’s important for security practitioners to understand both some of the details but also how all of this fits together, even if you aren’t the one running scans and interpreting the raw outputs.