 Defense
Imagine the scenario where you have an endpoint or server running and you don’t have centralised logging or visualisation of log data and you need to perform some rapid analysis without wanting to stand up a new set of VMs or services, well this is where cloud really can come into it’s own.
Very rapidly we can setup a Datadog account. (this blog will be updated as I deploy and configure)
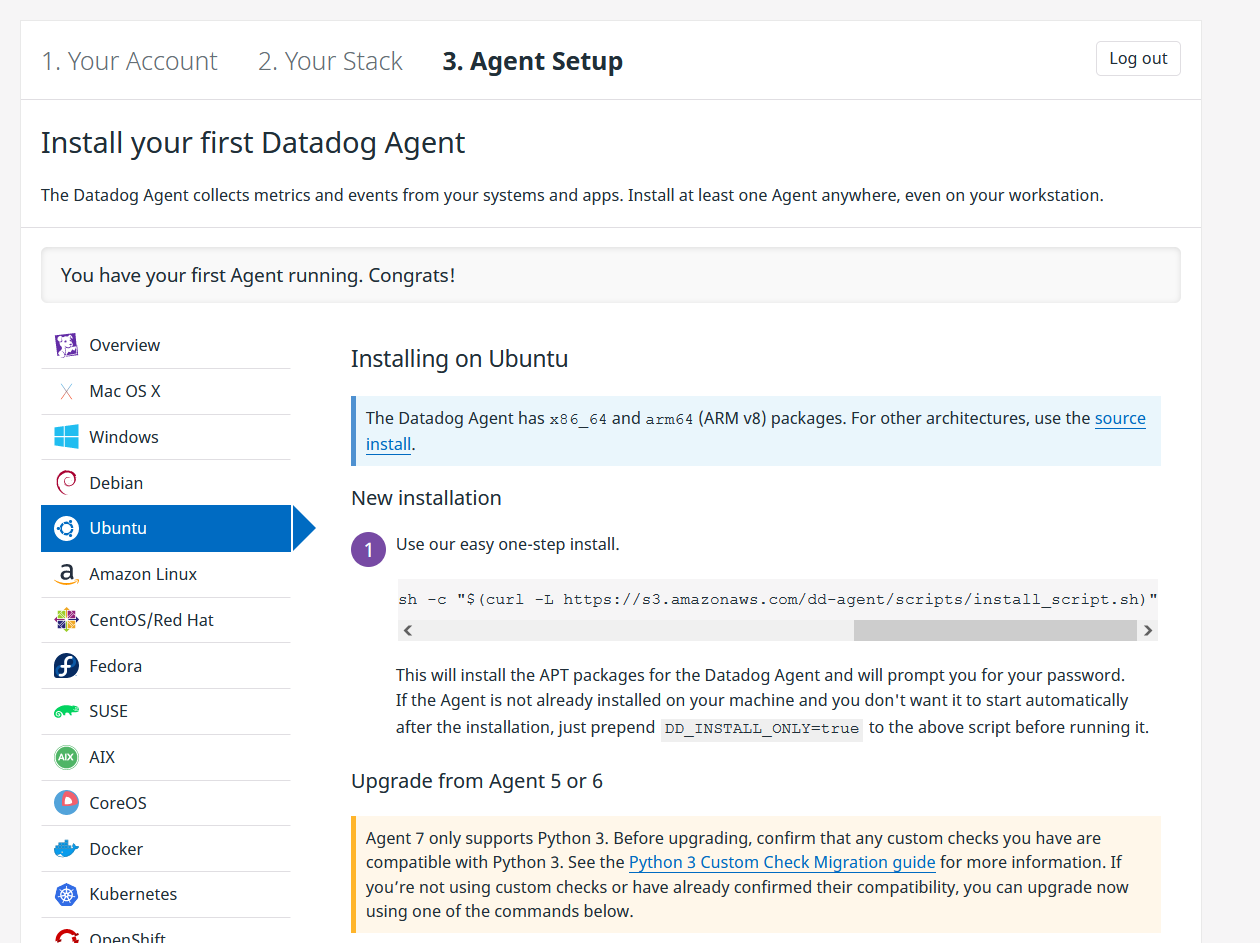
We can deploy the agent in Ubuntu (for example) in a one liner:
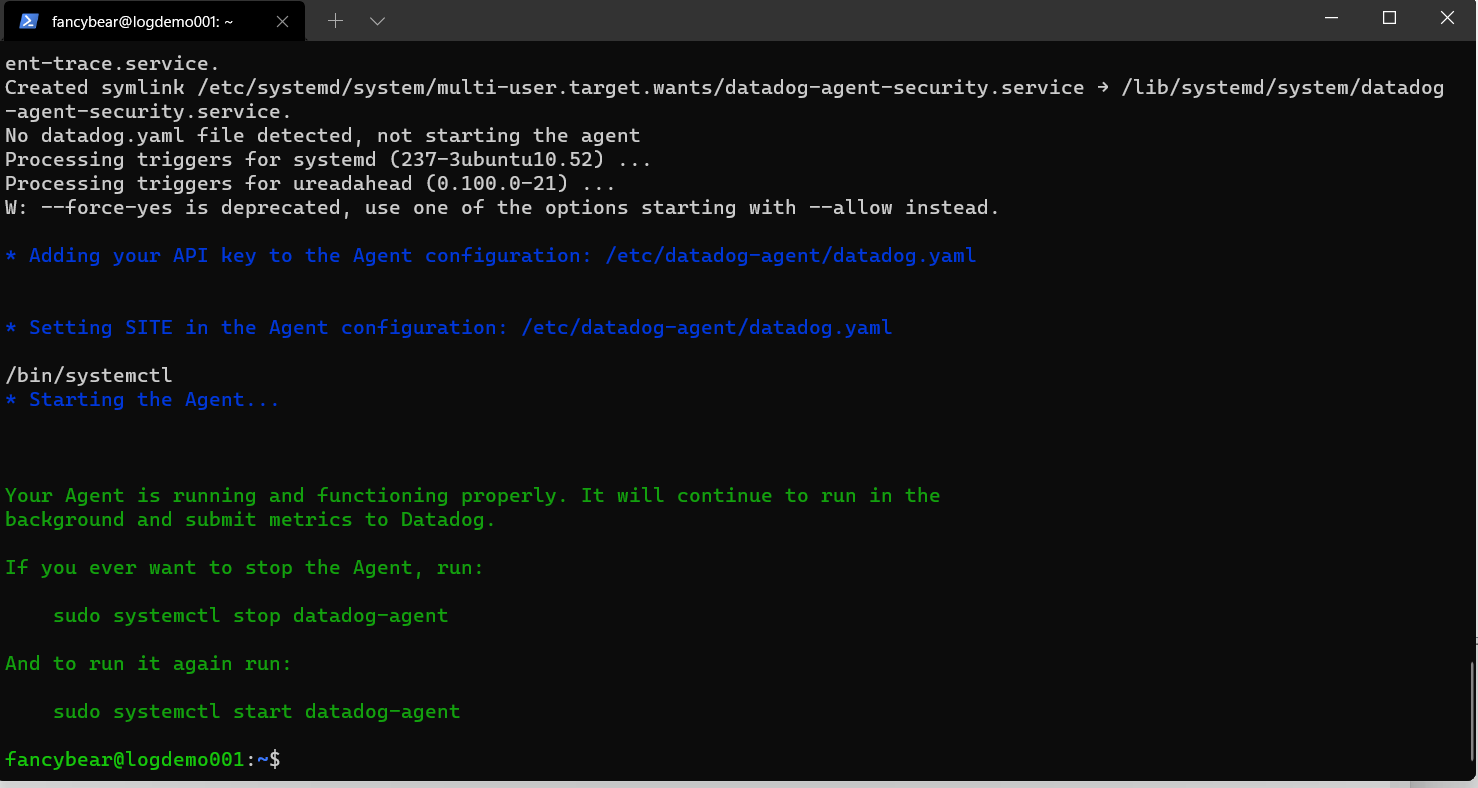
And then we are ready! Note you can also build from source!

Ok so we are sending some data, but we haven’t configured sources etc.
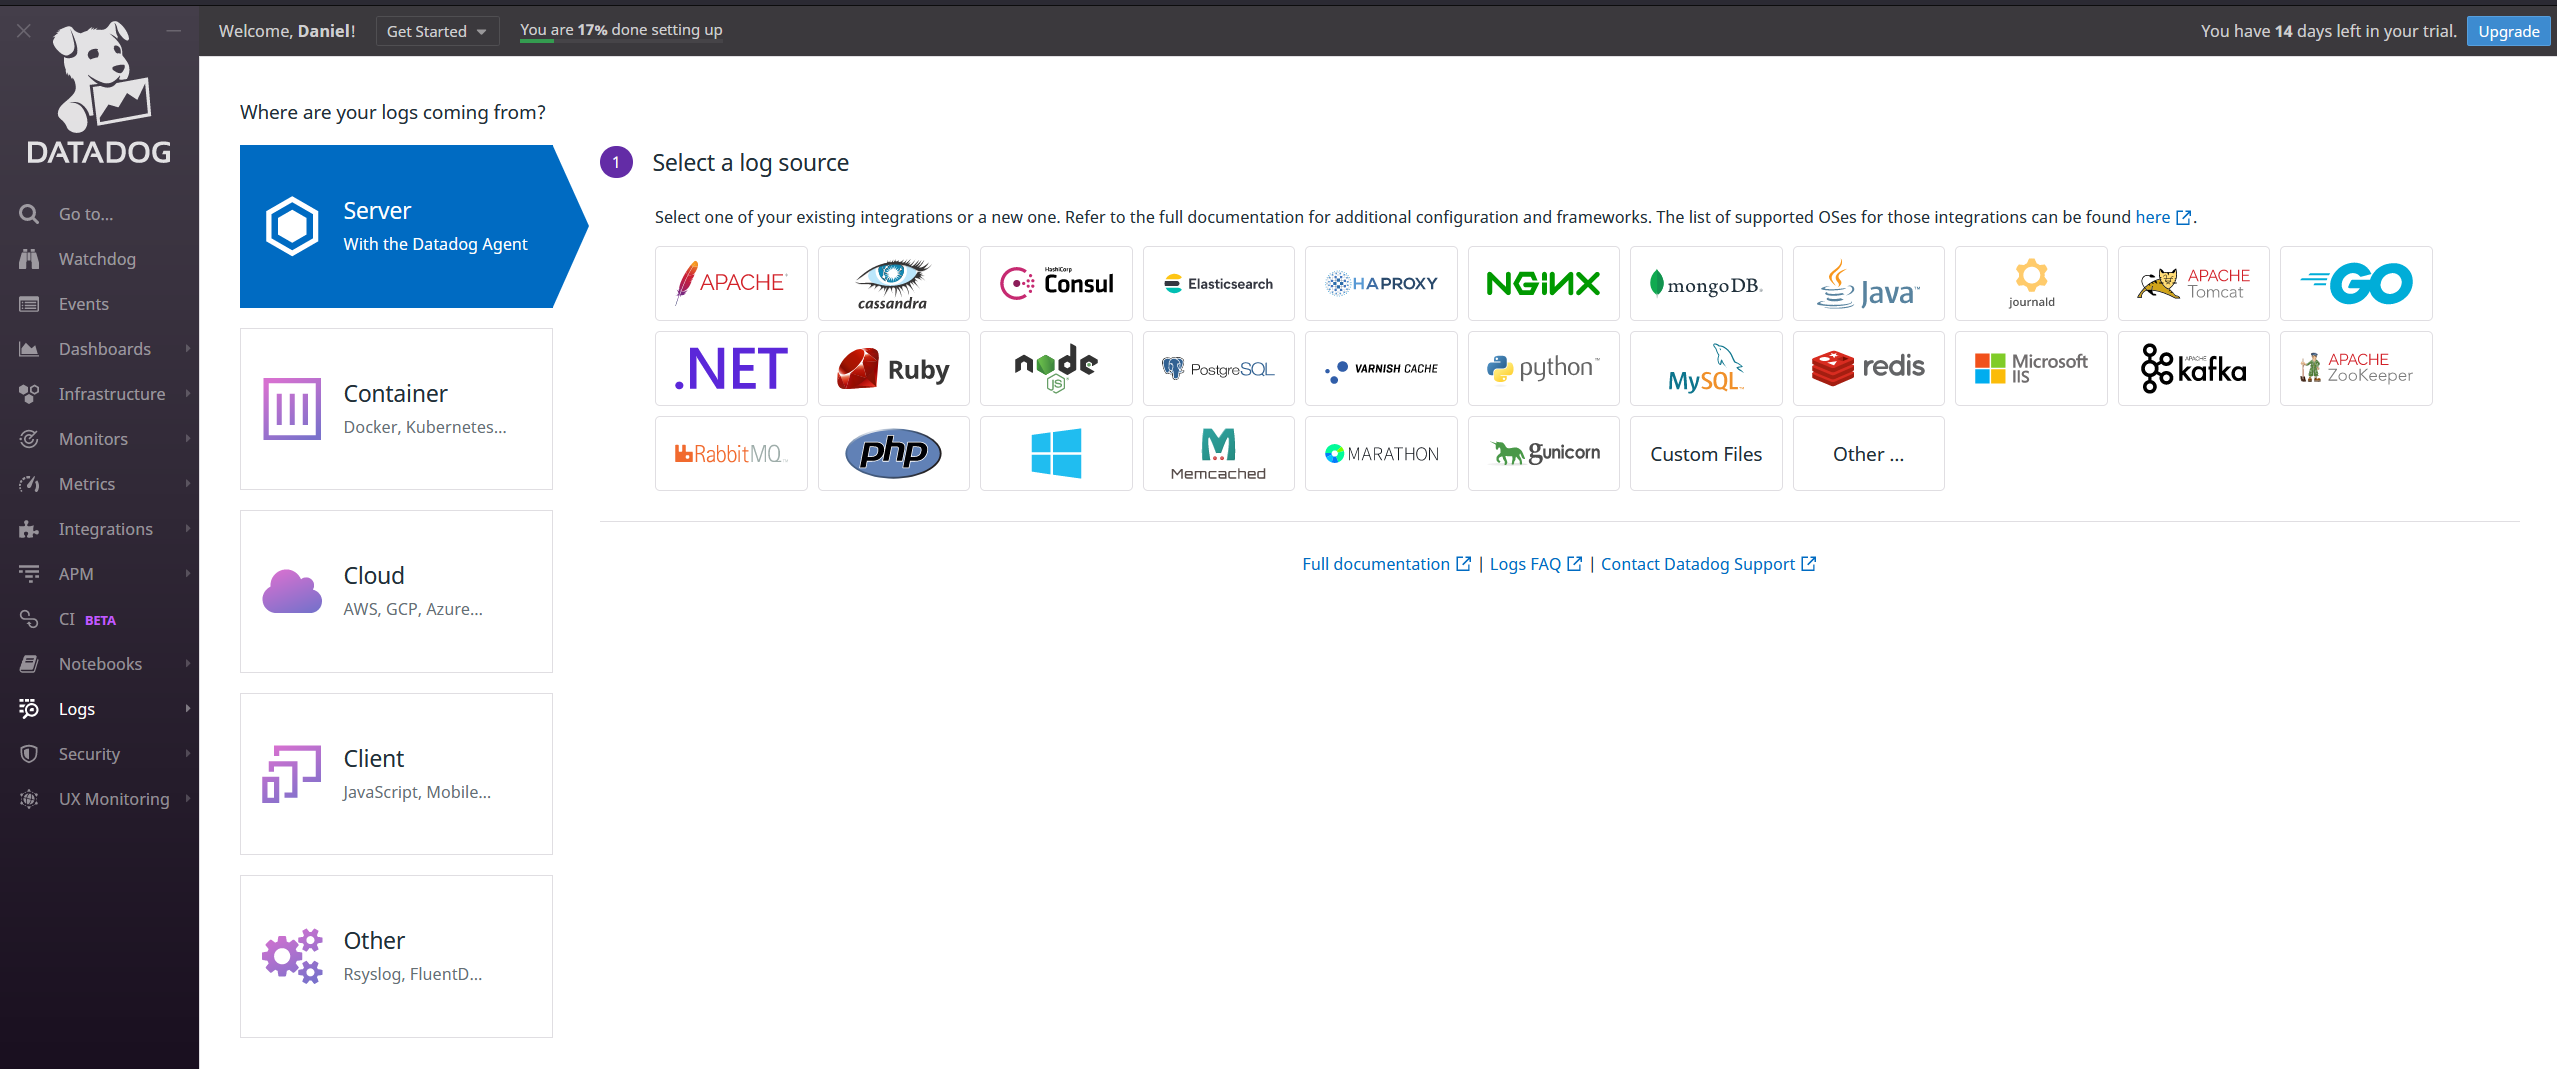
If we navigate to logs we can look to setup some sources on our agent.
Let’s install apache2 quickly on the VM.

Install the datadog agent

So the agent config is held here:
| sudo nano /etc/datadog-agent/datadog.yaml |
Logs are disabled by default
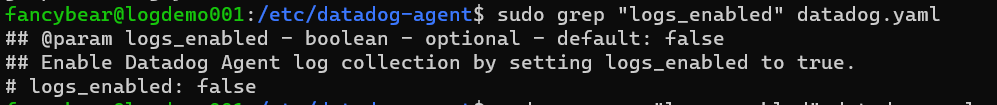
Let’s find the line number
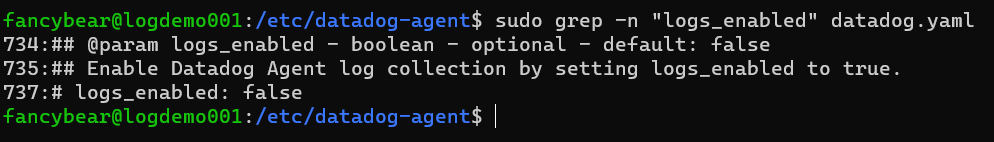
sudo nano +737 /etc/datadog-agent/datadog.yaml
Let’s remove the #
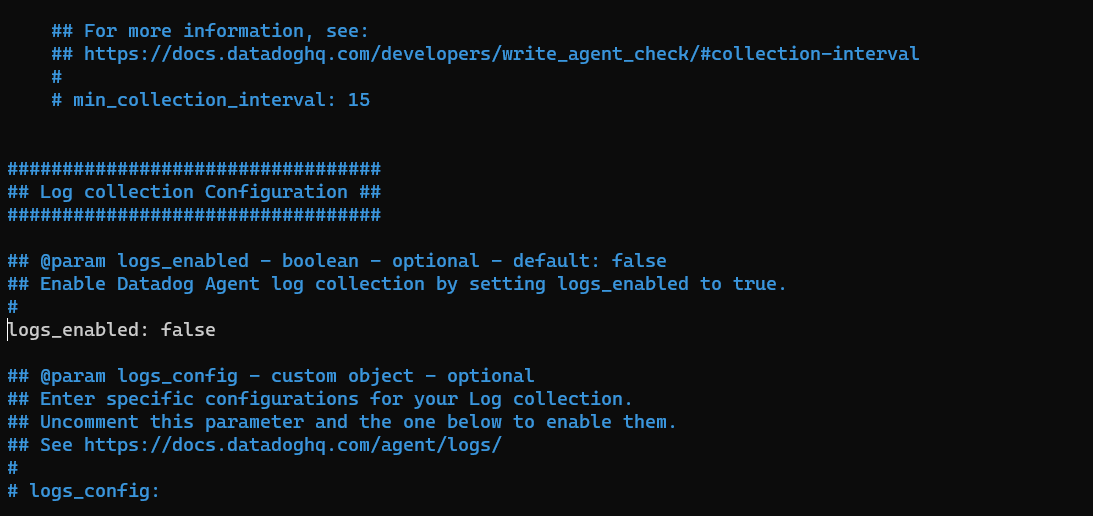
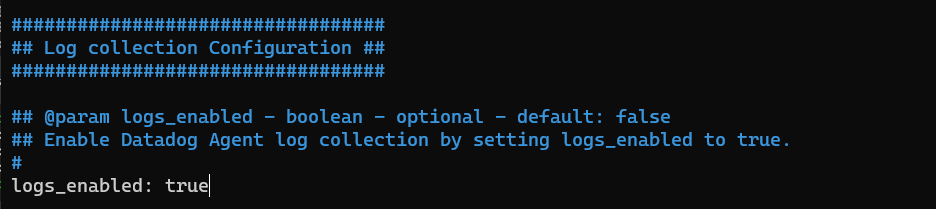
And change false to true
And save the file
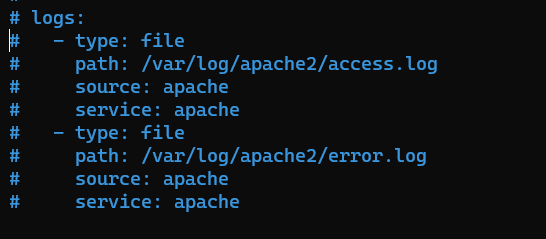
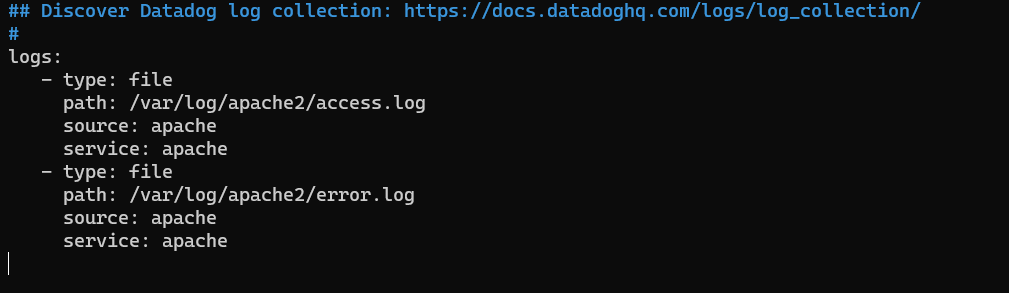
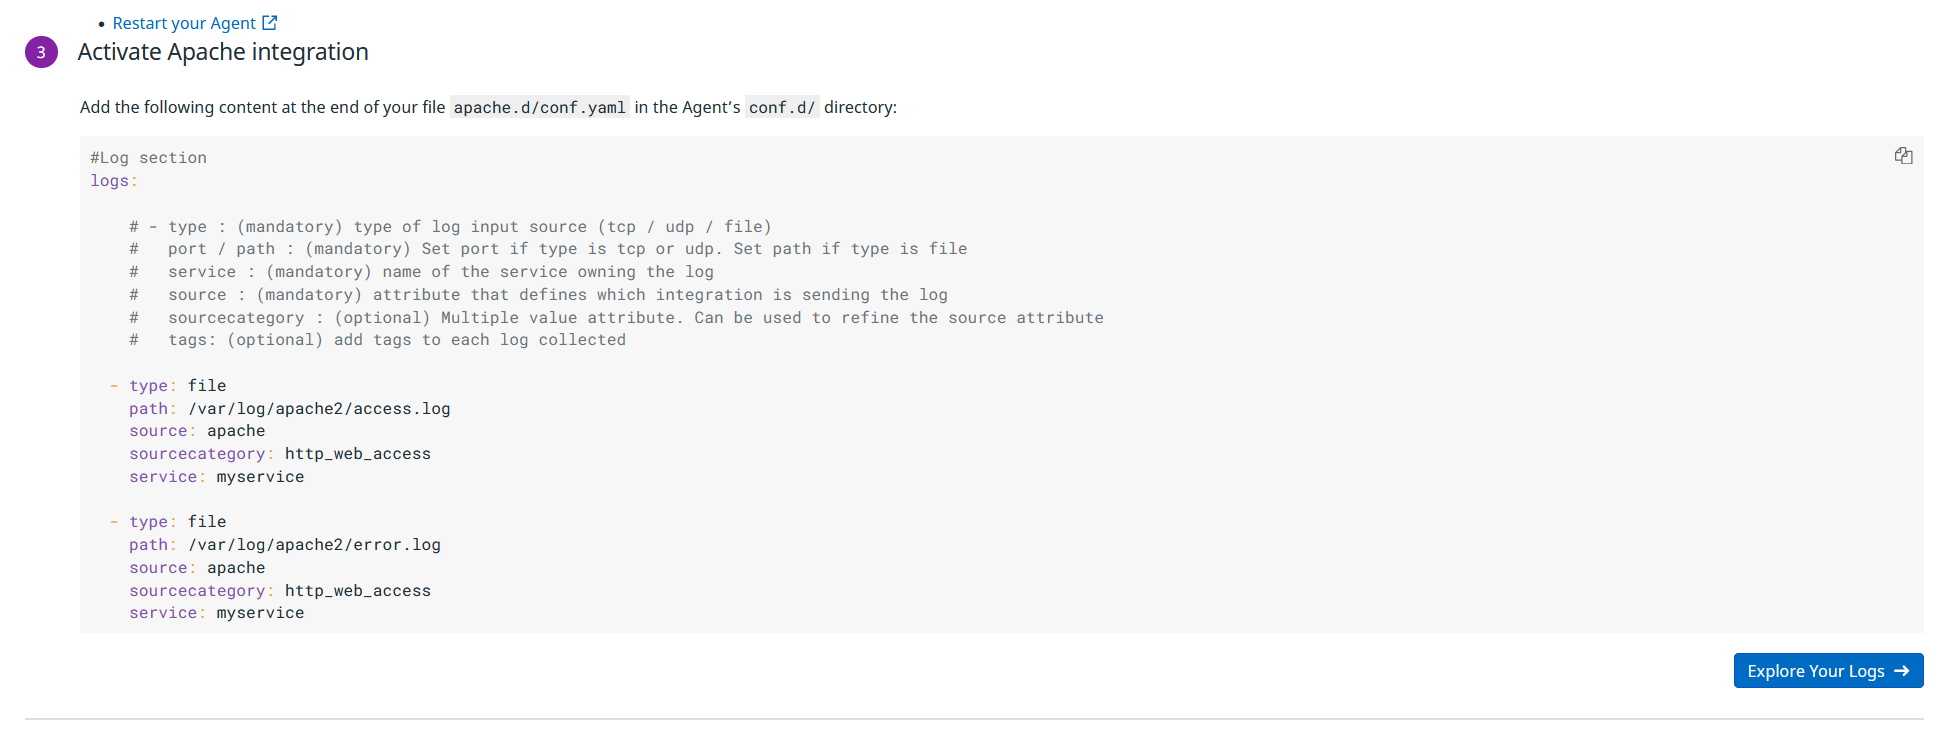
Now lets enable apache logs in the apache.d/conf.yaml file
![]()
Copy the example file
| sudo cp apache.d/conf.yaml.example apache.d/conf.yaml |
Remove the hashes:
Restart the agent

service datadog-agent restart

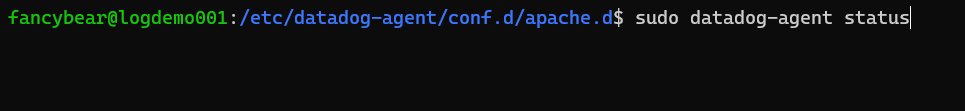
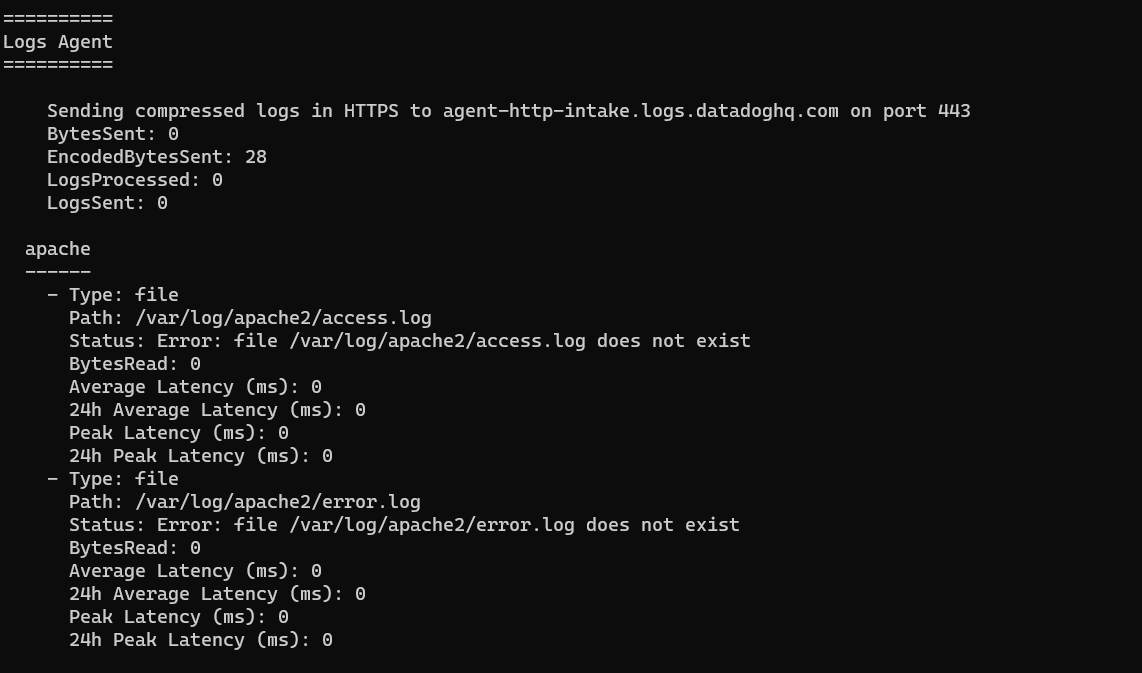
Let’s check the status
This says the log file does not exist:
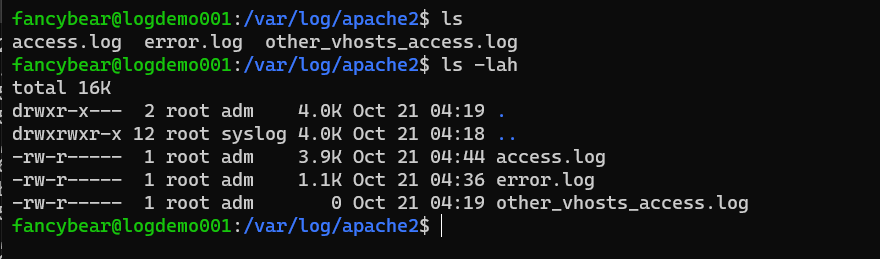
Well, let’s check that:
Let’s give the agent permissions
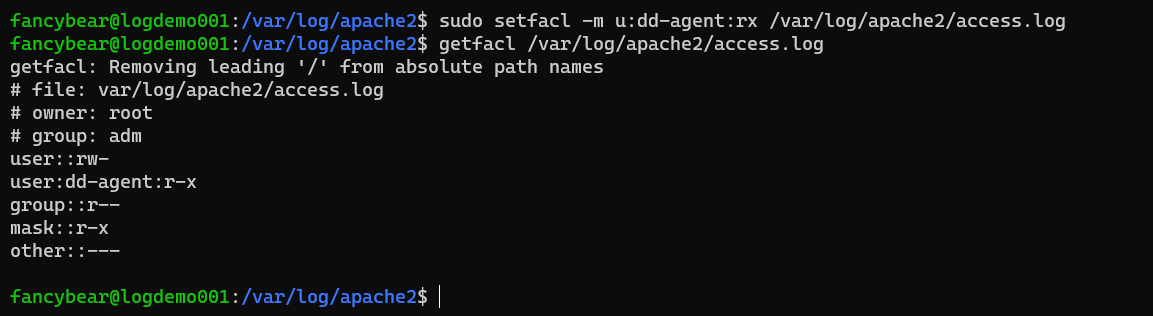
| sudo chmod 655 -R /var/log/apache2/
sudo setfacl -m u:dd-agent:rx /var/log/apache2/access.log sudo setfacl -m u:dd-agent:rx /var/log/apache2/error.log sudo setfacl -m u:dd-agent:rx /var/log/apache2/* |
Check the agent status:
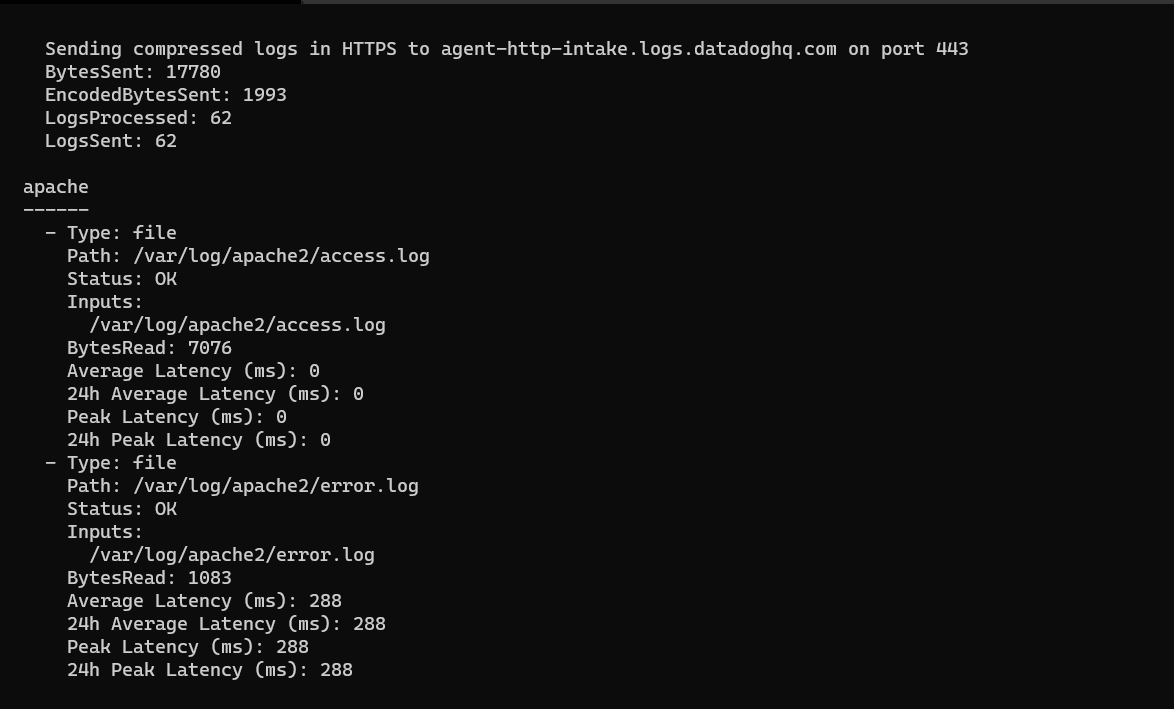
We can now explore the logs:
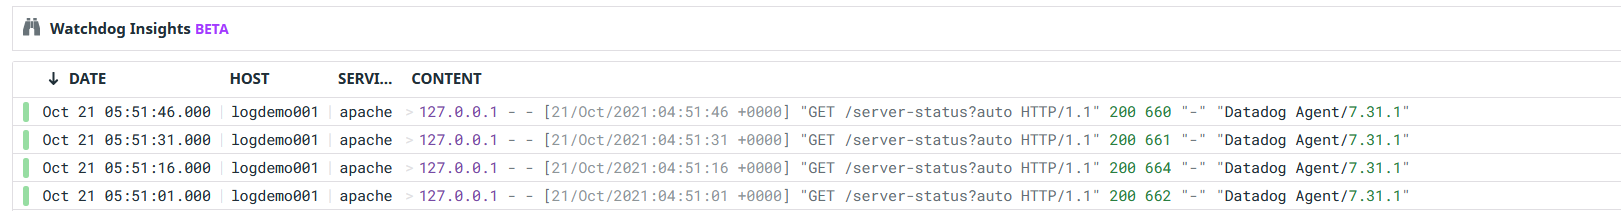
Now one thing we should think about immediately is post logging! But for now it’s time for a tea!
Ok a few tea’s complete. We’ve now deployed a second VM and attached this. Again we installed apache.
A key thing we need to look at is WHAT logs are we collecting? WHAT scenarios do they cater for? (e.g. this doesn’t capture post requests at the minute). We’ve also go to think about costs, we’ve not only added logs we’ve also enabled the platform security feature. We are on a 14 day trial but 14 day’s isn’t going to get us through the excercise. The VM costs are about £8 per month each. We can spin some up in other clouds as well. Say we allocate £10 for IaaS costs per month per VM. We need to then configure our logs (and tune) we also need to then baseline costs. Let’s see how this goes!